Shape Analysis
Two curves can look different point-by-point yet share the same shape -- when the difference is only a matter of parameterization (timing), a vertical baseline shift, or an overall magnitude. Shape analysis studies the geometry of functional data after factoring out such nuisance transformations. The formal device is a quotient space: curves that differ only by a nuisance transformation are identified as the same point. The elastic (Fisher-Rao) framework, via the SRSF representation, makes this quotient geometry computable.
fdars provides tools for shape representatives and distances (this quotient geometry), for the shape mean (a Karcher mean in quotient space), and -- going beyond the quotient basics -- for elastic depth and elastic FPCA that decompose variability into amplitude and phase components.
| Function | Role |
|---|---|
shape_distance |
Elastic distance between curves modulo warping |
shape_mean |
Karcher mean (average shape) in a chosen quotient |
shape_self_distance_matrix |
All pairwise shape distances (for clustering/MDS) |
reparameterize_curve |
Apply a warp \(\gamma\) to a curve (move within an orbit) |
A sample of curves that share a common shape but differ in amplitude and timing (left) collapses onto a single sharp template once the warping is factored out. The elastic mean shape -- the Karcher mean under the Fisher-Rao metric (right, orange) -- recovers that template, whereas the naive cross-sectional mean (right, dashed) is flattened by the phase spread.
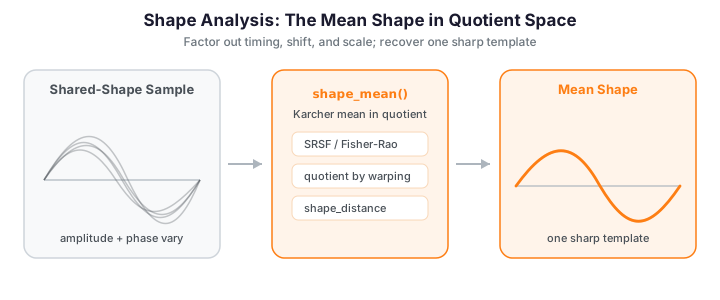
The dashed red cross-sectional mean is a washed-out compromise -- it averages heights at fixed times across curves that peak at different times. The solid orange elastic mean shape instead recovers a crisp representative that actually resembles the individual curves, because it averages after removing phase. That contrast is the motivation for shape-space statistics.
The quotient geometry
Shape analysis lives in a quotient space. Write a curve as a function \(f:[0,1]\to\mathbb{R}\). The nuisance transformations form a group \(\Gamma\) of orientation-preserving diffeomorphisms (warps) \(\gamma:[0,1]\to[0,1]\) with \(\gamma(0)=0\), \(\gamma(1)=1\) and \(\dot\gamma>0\). The group acts on curves by composition,
and the set of all curves reachable from \(f\) this way is its orbit \([f]=\{\,f\circ\gamma : \gamma\in\Gamma\,\}\). Two curves have the same shape iff they lie in the same orbit. The shape space is the quotient \(\mathcal{F}/\Gamma\), and a shape distance must be a proper distance on that quotient.
Why the \(\mathbb{L}^2\) metric fails
The naive attempt — align by minimizing \(\|f_1 - f_2\circ\gamma\|_{\mathbb{L}^2}\) over \(\gamma\) — is not a distance on the quotient, because the \(\mathbb{L}^2\) inner product is not preserved by warping:
Reparameterizing both curves changes the value, so the "distance" depends on where in each orbit you happen to sit. This produces the pinching pathology: the optimizer buys artificially small residuals by warping mass into a thin spike. The elastic (Fisher-Rao) framework fixes this.
The square-root slope function (SRSF)
Represent a curve by its square-root slope function (also called SRVF in the curve setting),
with inverse \(f(t)=f(0)+\int_0^t q(s)\,|q(s)|\,ds\). The map \(f\mapsto q\) trades the original curve for its (signed square-rooted) velocity. The decisive property is how the group action transforms in this representation. If \(\tilde f = f\circ\gamma\), its SRSF is
The extra \(\sqrt{\dot\gamma}\) Jacobian factor is exactly what is needed to make the action an isometry of \(\mathbb{L}^2\):
by the change of variables \(s=\gamma(t)\). So the complicated Fisher-Rao Riemannian metric on curve space becomes the flat \(\mathbb{L}^2\) metric on SRSF space — and warping is a norm-preserving rotation there. This is the whole point of the SRSF transform: it linearizes the elastic geometry.
import numpy as np
from docs_fig import fig, render
from fdars.alignment import srsf_transform, reparameterize_curve

t = np.linspace(0, 1, 200)
f = np.sin(2 * np.pi * t) + 0.4 * np.sin(4 * np.pi * t)

# a warp and the warped curve
gamma = t ** 1.8
gamma = (gamma - gamma.min()) / np.ptp(gamma)
f_w = reparameterize_curve(f, t, gamma)

q   = np.asarray(srsf_transform(f, t))
q_w = np.asarray(srsf_transform(f_w, t))

# L2 norms: preserved in SRSF space, not in curve space
nrm = lambda a: np.sqrt(np.trapezoid(a ** 2, t))
f_norms = (nrm(f), nrm(f_w))
q_norms = (nrm(q), nrm(q_w))

f_, (a1, a2) = fig(ncols=2, figsize=(9.8, 4.0))
a1.plot(t, f,   color="#3f51b5", lw=2.0, label="$f$")
a1.plot(t, f_w, color="#e8710a", lw=2.0, label=r"$f\circ\gamma$")
a1.set(title=f"Curve space: $\\|f\\|$={f_norms[0]:.3f}, "
             f"$\\|f\\circ\\gamma\\|$={f_norms[1]:.3f}",
       xlabel="t", ylabel="f(t)")
a1.legend(fontsize=9)

a2.plot(t, q,   color="#3f51b5", lw=2.0, label="$q$")
a2.plot(t, q_w, color="#e8710a", lw=2.0, label=r"$(q,\gamma)$")
a2.set(title=f"SRSF space: $\\|q\\|$={q_norms[0]:.3f}, "
             f"$\\|(q,\\gamma)\\|$={q_norms[1]:.3f}",
       xlabel="t", ylabel="q(t)")
a2.legend(fontsize=9)
print(render(f_))
The two curves on the left have visibly different \(\mathbb{L}^2\) norms; their SRSFs on the right have (to discretization error) the same norm — the \(\sqrt{\dot\gamma}\) factor makes warping an isometry, which is precisely why the elastic metric behaves.
Numerical validation: the SRSF map is an \(\mathbb{L}^2\) isometry
The defining property is stronger than norm preservation: warping both curves by a common \(\gamma\) leaves the \(\mathbb{L}^2\) distance between their SRSFs unchanged, \(\|q_1 - q_2\|_{\mathbb{L}^2} = \|(q_1,\gamma) - (q_2,\gamma)\|_{\mathbb{L}^2}\). Below we take two curves, apply the same warp to both, and confirm the SRSF distance is invariant. The residual is pure discretization error (it shrinks as the grid refines), so we assert a relative tolerance.
SRSF distance before warp: 2.418271 SRSF distance after warp: 2.417427 relative deviation (isometry error): 3.49e-04
The two printed SRSF distances -- before and after applying the same warp to both curves -- agree to well under a percent, so warping is an isometry up to discretization. This is the property that makes shape distances well defined: reparameterizing both curves together leaves their separation unchanged.
Geodesic distance in shape space
On the SRSF sphere the geodesic distance between two representatives is the arc length
and the shape (elastic) distance minimizes this over the warping orbit of one curve:
Because the action is by isometries, this infimum is a genuine distance on the quotient \(\mathcal{F}/\Gamma\): it is symmetric, non-negative, zero exactly when the orbits coincide, and satisfies the triangle inequality. The optimization over \(\gamma\) is solved by dynamic programming. curve_geodesic returns the whole minimizing path, not just its endpoints.
import numpy as np
from docs_fig import fig, render
from fdars.alignment import curve_geodesic

t = np.linspace(0, 1, 120)
f1 = np.exp(-((t - 0.5) ** 2) / 0.01)           # one bump (unimodal)
f2 = (np.exp(-((t - 0.3) ** 2) / 0.008)
      + np.exp(-((t - 0.7) ** 2) / 0.008))       # two bumps (bimodal, a different shape)

geo = curve_geodesic(f1, f2, t, n_points=7)
path = np.asarray(geo["curves"])                # (7, m) curves along geodesic
s    = np.asarray(geo["parameter_values"])      # path parameter in [0, 1]
darc = np.asarray(geo["distances"])             # cumulative arc length

f_, (a1, a2) = fig(ncols=2, figsize=(9.8, 4.0))
cmap = __import__("matplotlib").cm.viridis
for k in range(path.shape[0]):
    a1.plot(t, path[k], color=cmap(s[k]), lw=1.8)
a1.plot(t, f1, color="#3f51b5", lw=2.8, label="$f_1$ (start)")
a1.plot(t, f2, color="#e8710a", lw=2.8, label="$f_2$ (end)")
a1.set(title="Geodesic path in shape space", xlabel="t", ylabel="f(t)")
a1.legend(fontsize=9)

a2.plot(s, darc, "o-", color="#3f51b5")
a2.set(title="Cumulative geodesic arc length",
       xlabel="path parameter s", ylabel="distance from start")
print(render(f_))

print(f"total shape geodesic distance: {darc[-1]:.4f}")
The right panel is the cleanest diagnostic: the cumulative arc length grows linearly in the path parameter, the signature of a constant-speed geodesic connecting the unimodal and bimodal shapes. In curve space (left) the path deforms the single bump toward the two-bump end; because the geodesic lives in the reparameterization quotient, the reconstructed intermediates stay close to the start shape until the second bump emerges near the far end, so the linear arc-length growth is the more reliable evidence of the geodesic than any single intermediate curve.
The Karcher mean as a shape average
There is no linear "average orbit," so the mean shape is defined intrinsically as the Karcher (Fréchet) mean — the orbit that minimizes the sum of squared shape distances:
It is computed by alternating between (i) aligning every curve's SRSF to the current mean by dynamic programming, and (ii) updating the mean to the \(\mathbb{L}^2\) average of the aligned SRSFs — a gradient descent on the shape manifold. shape_mean and karcher_mean implement this; the penalty \(\lambda\!\ge\!0\) regularizes the warps to prevent pinching on noisy data.
Shape distance (quotient space)
The shape distance measures how different two curves are in the quotient space obtained by modding out the group of warping functions. Unlike the raw elastic distance, the shape distance factors out both amplitude scaling and phase variation, leaving only the intrinsic "shape" of the curve.
import numpy as np
from fdars.alignment import shape_distance

t = np.linspace(0, 1, 101)
f1 = np.sin(2 * np.pi * t)
f2 = 1.5 * np.sin(2 * np.pi * (t - 0.1))  # scaled and shifted

result = shape_distance(f1, f2, t)

d          = result["distance"]     # shape distance (scalar)
gamma      = result["gamma"]        # optimal warping function
f2_aligned = result["f2_aligned"]   # f2 after alignment
| Key | Type | Description |
|---|---|---|
distance |
float |
Shape distance in quotient space |
gamma |
ndarray (m,) |
Optimal warping function |
f2_aligned |
ndarray (m,) |
Second curve aligned to first |
Shape vs. elastic distance
The elastic distance preserves amplitude differences. The shape distance removes them, so two curves with identical shape but different heights have shape distance near zero.
Orbits and quotient choices
Each curve belongs to an orbit -- the set of all curves reachable from it by the nuisance transformations. reparameterize_curve moves a curve within its reparameterization orbit by applying a warp \(\gamma\); the shape tools compare curves across orbits. The quotient controls which transformations are factored out:
quotient |
Factors out | Use when |
|---|---|---|
"reparameterization" |
Warping (timing differences) | Curves traversed at different speeds |
"translation" |
Vertical baseline shifts | Curves at different baselines |
"scale" |
Reparameterization + magnitude | Curves of different overall size |
from fdars.alignment import reparameterize_curve

t = np.linspace(0, 1, 101)
f = np.sin(2 * np.pi * t)
gamma = t ** 1.4; gamma = (gamma - gamma.min()) / np.ptp(gamma)  # a monotone warp
f_warped = reparameterize_curve(f, t, gamma)   # same orbit, different parameterization
A two-group worked example
The shape distance really earns its keep when groups differ in shape but each group also carries nuisance phase variation. Below, one group is unimodal (a single bump) and the other is bimodal (two bumps); within each group the peak positions jitter. Shape distance factors out that within-group jitter but preserves the unimodal-vs-bimodal difference, so within-group distances are small and cross-group distances are large -- and the distance matrix shows a clean block structure that ordinary hierarchical clustering separates perfectly. (Note: two curves that differ only in bump position -- e.g. a left bump vs. a right bump -- are the same shape under the reparameterization quotient, so they would not form separable groups; the groups must differ in genuine shape.)
import numpy as np
from docs_fig import fig, render
from fdars.alignment import shape_distance, shape_mean, shape_self_distance_matrix

rng = np.random.default_rng(42)
n, m = 30, 50
t = np.linspace(0, 1, m)
X = np.zeros((n, m))
for i in range(15):                       # unimodal group (one bump, jittered position)
    c = 0.5 + rng.normal(0, 0.05)
    X[i] = np.exp(-((t - c) ** 2) / 0.02) + rng.normal(0, 0.03, m)
for i in range(15, 30):                   # bimodal group (two bumps -> different shape)
    c = rng.normal(0, 0.05)
    X[i] = (np.exp(-((t - (0.3 + c)) ** 2) / 0.01)
            + np.exp(-((t - (0.7 + c)) ** 2) / 0.01)) + rng.normal(0, 0.03, m)

# within-group vs cross-group shape distance
d_same = shape_distance(X[0], X[5], t)["distance"]
d_diff = shape_distance(X[0], X[20], t)["distance"]

# shape means per group (Karcher mean in quotient space)
mu_left = np.asarray(shape_mean(X[:15], t, quotient="reparameterization", max_iter=20)["mean"])
mu_right = np.asarray(shape_mean(X[15:], t, quotient="reparameterization", max_iter=20)["mean"])

# full pairwise shape-distance matrix -> block structure
D = np.asarray(shape_self_distance_matrix(X, t, quotient="reparameterization"))

f, (a1, a2) = fig(ncols=2, figsize=(9.8, 4.0))
a1.plot(t, X[:15].T, color="#3f51b5", lw=0.7, alpha=0.3)
a1.plot(t, X[15:].T, color="#e8710a", lw=0.7, alpha=0.3)
a1.plot(t, mu_left, color="#3f51b5", lw=2.6, label="unimodal shape mean")
a1.plot(t, mu_right, color="#e8710a", lw=2.6, label="bimodal shape mean")
a1.set(title="Two shape groups + Karcher shape means", xlabel="t", ylabel="f(t)")
a1.legend(fontsize=8)

im = a2.imshow(D, cmap="plasma", origin="lower")
a2.set(title="Shape-distance matrix (block structure)",
       xlabel="curve", ylabel="curve")
f.colorbar(im, ax=a2, fraction=0.046, shrink=0.85)
print(render(f))

print(f"within-group shape distance (1 vs 5):  {d_same:.4f}")
print(f"cross-group  shape distance (1 vs 20): {d_diff:.4f}")

# hierarchical clustering on the shape distances recovers the two groups
from scipy.cluster.hierarchy import linkage, fcluster
from scipy.spatial.distance import squareform
Z = linkage(squareform(D, checks=False), method="complete")
labels = fcluster(Z, t=2, criterion="maxclust")
group = np.array([0] * 15 + [1] * 15)
acc = max((labels == group + 1).mean(), (labels == 2 - group).mean())
print(f"2-cluster agreement with true groups: {acc:.0%}")
The within-group distance is small because the only within-group difference -- peak position -- is exactly the phase variation the quotient factors out, while the cross-group distance stays large because unimodal and bimodal are genuinely different shapes. The distance matrix's two dark diagonal blocks confirm it, and complete-linkage clustering recovers the groups.
shape_mean returns the same keys as karcher_mean (mean, mean_srsf, aligned_data, gammas, n_iter, converged); pass quotient= to choose which nuisance to factor out.
Best practices
- Pick the quotient to match the nuisance:
"reparameterization"for timing, add"translation"/"scale"for baseline/magnitude. - Check
shape_mean'sconverged; raisemax_iterif it isFalse. - Use
lambda_ > 0to prevent extreme warps on noisy or sparse data. - Smooth curves on a common grid before analysis, and inspect the returned
gammasto gauge how much reparameterization was needed.
Uncertainty of the mean shape
A point estimate of the mean shape is not enough — we want a confidence band around it. shape_confidence_interval bootstraps the sample: it resamples curves with replacement, recomputes the shape mean of each resample, and reports pointwise percentile bands of those bootstrap means. Because the mean is estimated after factoring out phase, the band reflects genuine shape (amplitude-in-quotient) uncertainty rather than being inflated by misalignment.
import numpy as np
from docs_fig import fig, render
from fdars.alignment import shape_confidence_interval

rng = np.random.default_rng(11)
n, m = 24, 80
t = np.linspace(0, 1, m)
base = np.exp(-((t - 0.5) ** 2) / 0.03)         # common bump shape
data = np.zeros((n, m))
for i in range(n):
    warp = np.clip(t + 0.10 * rng.standard_normal() * np.sin(np.pi * t), 0, 1)
    data[i] = (1.0 + 0.15 * rng.standard_normal()) * np.interp(t, warp, base) \
              + 0.03 * rng.standard_normal(m)

ci = shape_confidence_interval(data, t, n_bootstrap=120, confidence_level=0.90,
                               max_iter=12, seed=1)
mu    = np.asarray(ci["mean"])
lower = np.asarray(ci["lower_band"])
upper = np.asarray(ci["upper_band"])

f, ax = fig()
ax.plot(t, data.T, color="#6c757d", lw=0.7, alpha=0.25)
ax.fill_between(t, lower, upper, color="#e8710a", alpha=0.25,
                label="90% bootstrap band")
ax.plot(t, mu, color="#e8710a", lw=2.6, label="mean shape")
ax.set(title="Mean shape with bootstrap confidence band",
       xlabel="t", ylabel="f(t)")
ax.legend(fontsize=9)
print(render(f))

width = float(np.trapezoid(upper - lower, t))
print(f"mean band width (integrated): {width:.4f}")
The orange band traces where the mean shape is precisely pinned (narrow) versus uncertain (wide), and because it is built from bootstrap resamples of aligned shapes it measures amplitude uncertainty rather than residual phase jitter. The integrated width printed below gives a single scalar for how tightly the sample determines the mean.
| Key | Type | Description |
|---|---|---|
mean |
ndarray (m,) |
Estimated mean shape |
lower_band |
ndarray (m,) |
Pointwise lower confidence limit |
upper_band |
ndarray (m,) |
Pointwise upper confidence limit |
bootstrap_means |
ndarray (B, m) |
The n_bootstrap resampled mean shapes |
Pointwise, not simultaneous
shape_confidence_interval returns pointwise percentile bands from the bootstrap distribution of the mean shape. They are not simultaneous (family-wise) bands and do not correct for multiplicity across t; for simultaneous coverage of an aligned mean, see the tolerance/simultaneous-band tools in fdars.tolerance.
Elastic depth
Elastic depth ranks functional observations from center to periphery using the elastic metric. It decomposes into amplitude and phase components, enabling separate outlier detection in each source of variability.
import numpy as np
from fdars import Fdata
from fdars.alignment import elastic_depth

np.random.seed(0)
n, m = 40, 101
t = np.linspace(0, 1, m)
fd = Fdata(
    np.array([
        np.sin(2 * np.pi * (t - 0.1 * np.random.randn()))
        + 0.3 * np.random.randn()
        for _ in range(n)
    ]),
    argvals=t,
)

result = elastic_depth(fd.data, fd.argvals, lambda_=0.0)

amp_depth  = result["amplitude_depth"]    # (n,)
ph_depth   = result["phase_depth"]        # (n,)
comb_depth = result["combined_depth"]     # (n,)
amp_dists  = result["amplitude_distances"]  # (n, n)
ph_dists   = result["phase_distances"]      # (n, n)

# Most central curve (highest combined depth)
median_idx = np.argmax(comb_depth)
print(f"Elastic median: curve {median_idx}")
print(f"  Amplitude depth: {amp_depth[median_idx]:.4f}")
print(f"  Phase depth:     {ph_depth[median_idx]:.4f}")

# Potential outliers (lowest depth)
outlier_idx = np.argmin(comb_depth)
print(f"Most outlying:  curve {outlier_idx}")
| Key | Type | Description |
|---|---|---|
amplitude_depth |
ndarray (n,) |
Depth based on amplitude distances |
phase_depth |
ndarray (n,) |
Depth based on phase distances |
combined_depth |
ndarray (n,) |
Joint amplitude+phase depth |
amplitude_distances |
ndarray (n, n) |
Pairwise amplitude distance matrix |
phase_distances |
ndarray (n, n) |
Pairwise phase distance matrix |
Diagnostic plots
Plot amplitude depth vs. phase depth in a scatter plot. Curves far from the cluster center in either dimension are outlying in that specific source of variability.
Shading each curve by its combined elastic depth turns the sample into a visual centre-outward ordering: the deepest curve (the elastic median, orange) sits at the heart of the band, while shallow curves fade toward the edges.
Opacity encodes elastic depth: the darkest curve (highlighted orange) is the elastic median -- the most central shape -- while the faint outer curves are the shallowest, least typical members. Because depth is computed in the elastic space, a curve is "deep" when its shape is central, independent of whether its peaks arrived early or late.
Elastic FPCA
Standard FPCA conflates amplitude and phase variation into a single set of principal components. Elastic FPCA performs PCA in the aligned (elastic) space, yielding separate decompositions of amplitude and phase variability.
Vertical (amplitude) FPCA
Extracts the principal modes of amplitude variation from the aligned curves.
from fdars.alignment import vert_fpca

result = vert_fpca(fd.data, fd.argvals, n_comp=3, lambda_=0.0, max_iter=20, tol=1e-4)

scores      = result["scores"]              # (n, 3) -- amplitude PC scores
eigfun_q    = result["eigenfunctions_q"]     # (3, m+1) -- eigenfunctions in SRSF space
eigfun_f    = result["eigenfunctions_f"]     # (3, m) -- eigenfunctions in original space
eigenvalues = result["eigenvalues"]          # (3,)
cum_var     = result["cumulative_variance"]  # (3,)
mean_q      = result["mean_q"]              # (m+1,) -- mean SRSF

print(f"Amplitude variance explained: {cum_var[-1]*100:.1f}%")
| Key | Type | Description |
|---|---|---|
scores |
ndarray (n, k) |
Amplitude FPC scores |
eigenfunctions_q |
ndarray (k, m+1) |
Eigenfunctions in SRSF space |
eigenfunctions_f |
ndarray (k, m) |
Eigenfunctions in function space |
eigenvalues |
ndarray (k,) |
Eigenvalues |
cumulative_variance |
ndarray (k,) |
Cumulative proportion of variance |
mean_q |
ndarray (m+1,) |
Mean SRSF |
Horizontal (phase) FPCA
Extracts the principal modes of phase variation from the estimated warping functions.
from fdars.alignment import horiz_fpca

result = horiz_fpca(fd.data, fd.argvals, n_comp=3, lambda_=0.0, max_iter=20, tol=1e-4)

scores      = result["scores"]                # (n, 3) -- phase PC scores
eigfun_psi  = result["eigenfunctions_psi"]     # (3, m) -- in psi space
eigfun_gam  = result["eigenfunctions_gam"]     # (3, m) -- in gamma space
eigenvalues = result["eigenvalues"]            # (3,)
cum_var     = result["cumulative_variance"]    # (3,)
mean_psi    = result["mean_psi"]               # (m,) -- mean psi
shooting    = result["shooting_vectors"]       # (n, m) -- shooting vectors

print(f"Phase variance explained: {cum_var[-1]*100:.1f}%")
| Key | Type | Description |
|---|---|---|
scores |
ndarray (n, k) |
Phase FPC scores |
eigenfunctions_psi |
ndarray (k, m) |
Eigenfunctions in \(\psi\) representation |
eigenfunctions_gam |
ndarray (k, m) |
Eigenfunctions as warping functions |
eigenvalues |
ndarray (k,) |
Eigenvalues |
cumulative_variance |
ndarray (k,) |
Cumulative proportion of variance |
mean_psi |
ndarray (m,) |
Mean \(\psi\) |
shooting_vectors |
ndarray (n, m) |
Shooting vectors (tangent space) |
Joint FPCA
Combines amplitude and phase variation into a single joint decomposition, weighting the two sources via a balance parameter \(c\).
from fdars.alignment import joint_fpca

result = joint_fpca(fd.data, fd.argvals, n_comp=3, lambda_=0.0, max_iter=20, tol=1e-4)

scores     = result["scores"]              # (n, 3)
eigenvalues = result["eigenvalues"]        # (3,)
cum_var    = result["cumulative_variance"]  # (3,)
balance_c  = result["balance_c"]           # automatic balance parameter
vert_comp  = result["vert_component"]      # (k, m) -- amplitude part
horiz_comp = result["horiz_component"]     # (k, m) -- phase part

print(f"Balance parameter c = {balance_c:.4f}")
print(f"Joint variance explained: {cum_var[-1]*100:.1f}%")
| Key | Type | Description |
|---|---|---|
scores |
ndarray (n, k) |
Joint FPC scores |
eigenvalues |
ndarray (k,) |
Eigenvalues |
cumulative_variance |
ndarray (k,) |
Cumulative proportion of variance |
balance_c |
float |
Balance between amplitude and phase |
vert_component |
ndarray (k, m) |
Amplitude part of each eigenfunction |
horiz_component |
ndarray (k, m) |
Phase part of each eigenfunction |
When to use which?
- Vertical FPCA -- when you care only about amplitude variability (e.g., peak heights).
- Horizontal FPCA -- when you care only about timing variability (e.g., event onset).
- Joint FPCA -- when you want a unified low-dimensional representation for downstream tasks like regression or clustering.
Full example: amplitude vs. phase decomposition
import numpy as np
from fdars import Fdata
from fdars.alignment import (
    karcher_mean,
    vert_fpca,
    horiz_fpca,
    elastic_depth,
)

# --- Simulate ---
np.random.seed(123)
n, m = 60, 151
t = np.linspace(0, 1, m)

data = np.zeros((n, m))
for i in range(n):
    amp = 1.0 + 0.4 * np.random.randn()           # amplitude variation
    shift = 0.08 * np.random.randn()               # phase variation
    t_warp = np.clip(t + shift * np.sin(np.pi * t), 0, 1)
    data[i] = amp * np.sin(2 * np.pi * np.interp(t, t_warp, t))

fd = Fdata(data, argvals=t)

# --- Alignment ---
km = karcher_mean(fd.data, fd.argvals, lambda_=0.05)
print(f"Karcher mean converged: {km['converged']}")

# --- Amplitude FPCA ---
vfpca = vert_fpca(fd.data, fd.argvals, n_comp=3, lambda_=0.05)
print(f"Amplitude variance (3 PCs): {vfpca['cumulative_variance'][-1]*100:.1f}%")

# --- Phase FPCA ---
hfpca = horiz_fpca(fd.data, fd.argvals, n_comp=3, lambda_=0.05)
print(f"Phase variance (3 PCs):     {hfpca['cumulative_variance'][-1]*100:.1f}%")

# --- Elastic depth ---
depth = elastic_depth(fd.data, fd.argvals)
median_idx = np.argmax(depth["combined_depth"])
print(f"Elastic median: curve {median_idx}")
print(f"  Amp depth:  {depth['amplitude_depth'][median_idx]:.4f}")
print(f"  Phase depth: {depth['phase_depth'][median_idx]:.4f}")
See also
- Elastic alignment — the pairwise/
karcher_meanmachinery underlying the shape mean. - Amplitude & phase — the separated distances that shape distance and elastic depth are built from.
fdars.tolerance— simultaneous confidence/tolerance bands for aligned means.
References
- Srivastava, A. and Klassen, E. (2016). Functional and Shape Data Analysis. Springer Series in Statistics. Springer, New York. — The standard reference for the SRSF/SRVF representation, the Fisher-Rao metric, and quotient-space geometry.
- Srivastava, A., Klassen, E., Joshi, S. H. and Jermyn, I. H. (2011). "Shape Analysis of Elastic Curves in Euclidean Spaces." IEEE Transactions on Pattern Analysis and Machine Intelligence, 33(7), 1415–1428. — Introduces the elastic shape metric and geodesic computation via dynamic programming.
- Kurtek, S., Srivastava, A., Klassen, E. and Ding, Z. (2012). "Statistical Modeling of Curves Using Shapes and Related Features." Journal of the American Statistical Association, 107(499), 1152–1165. — Karcher-mean estimation and statistical modeling in shape space.
- Tucker, J. D., Wu, W. and Srivastava, A. (2013). "Generative models for functional data using phase and amplitude separation." Computational Statistics & Data Analysis, 61, 50–66. — Amplitude/phase decomposition and elastic FPCA.