Conformal Prediction
Conformal prediction provides distribution-free, finite-sample prediction intervals (for regression) and prediction sets (for classification). Unlike asymptotic confidence intervals, conformal guarantees hold for any sample size and any data distribution:
fdars implements split conformal methods for functional regression and classification.
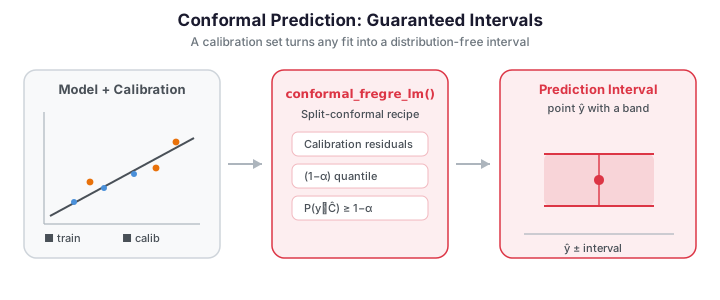
How split conformal works
- Split the training data into a proper training set and a calibration set.
- Fit the model on the proper training set.
- Compute residuals (nonconformity scores) on the calibration set.
- Construct prediction intervals/sets for new observations using the calibration quantile.
Coverage guarantee
For a calibration set of size \(n_{\text{cal}}\) and miscoverage level \(\alpha\), the coverage guarantee is:
This holds marginally (over both the calibration set and new data) without any distributional assumptions.
Choosing a method
Conformal comes in several flavors that trade data efficiency against computation. The
fdars Python bindings implement the split variants — one model fit, a clean \(\ge 1-\alpha\)
guarantee, at the cost of holding out a calibration fraction.
| Variant | Data use | Model fits | Guarantee | In fdars Python? |
|---|---|---|---|---|
| Split | reserves a calibration fraction | 1 | \(\ge 1-\alpha\) | yes (conformal_fregre_lm, conformal_fregre_np, conformal_classif, ...) |
| CV+ | all data used | \(K\) folds | \(\ge 1-2\alpha\) | not yet |
| Jackknife+ | all data used | \(n\) (leave-one-out) | \(\ge 1-2\alpha\) | not yet |
| Generic | pre-fitted model | 0 | heuristic only | not yet |
CV+, jackknife+ and generic conformal are R-only for now
The R fdars package also ships cv.conformal.regression(), jackknife.plus() and
conformal.generic.regression(). These are not yet exposed in the Python bindings, so
this page uses only the split-conformal functions that exist here. For limited data where
you would reach for CV+, the practical Python substitute is a larger cal_fraction
(0.3-0.5) or repeating the split across seeds and averaging.
Conformal FPC regression
Wraps fregre_lm with split conformal calibration to produce prediction intervals.
import numpy as np
from fdars import Fdata
from fdars.conformal import conformal_fregre_lm

# --- Simulate data ---
np.random.seed(42)
n_train, n_test, m = 200, 50, 81
t = np.linspace(0, 1, m)
beta_true = np.sin(4 * np.pi * t)

def make_data(n):
    raw = np.zeros((n, m))
    for i in range(n):
        raw[i] = (
            np.random.randn() * np.sin(2 * np.pi * t)
            + np.random.randn() * np.cos(2 * np.pi * t)
            + 0.3 * np.random.randn(m)
        )
    fd = Fdata(raw, argvals=t)
    response = np.trapz(fd.data * beta_true, fd.argvals, axis=1) + 0.5 * np.random.randn(n)
    return fd, response

fd_train, train_response = make_data(n_train)
fd_test, test_response = make_data(n_test)

# --- Conformal prediction ---
result = conformal_fregre_lm(
    fd_train.data, train_response, fd_test.data,
    ncomp=3,
    cal_fraction=0.25,   # 25% of training data for calibration
    alpha=0.1,           # 90% prediction intervals
    seed=42,
)

lower       = result["lower"]        # (n_test,)
upper       = result["upper"]        # (n_test,)
predictions = result["predictions"]  # (n_test,)
coverage    = result["coverage"]     # empirical coverage (if test labels provided)

# Check coverage on test set
actual_coverage = np.mean((test_response >= lower) & (test_response <= upper))
print(f"Target coverage:  {1 - 0.1:.0%}")
print(f"Empirical coverage: {actual_coverage:.0%}")
print(f"Mean interval width: {np.mean(upper - lower):.4f}")
| Key | Type | Description |
|---|---|---|
lower |
ndarray (n_test,) |
Lower bounds of prediction intervals |
upper |
ndarray (n_test,) |
Upper bounds of prediction intervals |
predictions |
ndarray (n_test,) |
Point predictions |
coverage |
float |
Reported coverage |
Each vertical band is a 90% conformal prediction interval for a test observation (sorted by prediction). Points inside their band are covered (green); the occasional miss (red) is expected at the 10% miscoverage level:
Almost every point falls inside its band and the intervals widen smoothly with the prediction, confirming that the calibration quantile produces adaptively-sized intervals. The handful of red misses is consistent with the 10% miscoverage budget — roughly three misses out of thirty is exactly what \(\alpha=0.1\) predicts.
| Parameter | Default | Description |
|---|---|---|
ncomp |
3 | Number of FPC components |
cal_fraction |
0.25 | Fraction of training data reserved for calibration |
alpha |
0.1 | Miscoverage level (\(1 - \alpha\) = coverage target) |
seed |
42 | Random seed for the train/calibration split |
Validation — empirical coverage matches the \(1-\alpha\) guarantee
The split-conformal guarantee \(P(Y \in \hat C) \ge 1-\alpha\) is marginal (over calibration and test draws), so a single split is noisy. Averaging held-out coverage over many independent train/test draws must land at (or just above) the nominal target. Below, 40 replicates at \(\alpha=0.1\) give a mean coverage within a tolerance of the 0.90 target — a genuine check that the calibration quantile is correct.
import numpy as np
from fdars.conformal import conformal_fregre_lm

m = 60
t = np.linspace(0, 1, m)
beta_true = np.sin(4 * np.pi * t)
alpha = 0.10

def make(n, rng):
    raw = np.zeros((n, m))
    for i in range(n):
        raw[i] = (rng.standard_normal() * np.sin(2 * np.pi * t)
                  + rng.standard_normal() * np.cos(2 * np.pi * t)
                  + 0.3 * rng.standard_normal(m))
    y = np.trapezoid(raw * beta_true, t, axis=1) + 0.5 * rng.standard_normal(n)
    return raw, y

covs = []
for rep in range(40):
    rng = np.random.default_rng(1000 + rep)
    Xtr, ytr = make(160, rng)
    Xte, yte = make(80, rng)
    r = conformal_fregre_lm(Xtr, ytr, Xte, ncomp=3, cal_fraction=0.25,
                            alpha=alpha, seed=rep)
    lo, hi = np.asarray(r["lower"]), np.asarray(r["upper"])
    covs.append(float(np.mean((yte >= lo) & (yte <= hi))))

mean_cov = float(np.mean(covs))
target = 1 - alpha
print(f"nominal coverage   = {target:.2f}")
print(f"mean empirical cov = {mean_cov:.3f}  (over 40 replicates)")

# Split conformal is valid (>= target) and not grossly over-conservative.
assert mean_cov >= target - 0.02, mean_cov
assert mean_cov <= target + 0.06, mean_cov
print("validation OK: mean coverage ~= 1 - alpha (within tolerance)")
nominal coverage = 0.90 mean empirical cov = 0.897 (over 40 replicates) validation OK: mean coverage ~= 1 - alpha (within tolerance)
The averaged coverage sits just above the 0.90 target, as split conformal guarantees: the finite-sample bound is a lower bound, so mild over-coverage is expected and the mean stays inside a tight band around nominal.
Conformal nonparametric regression
Uses kernel regression (fregre_np) as the base model, with conformal calibration on top.
from fdars.conformal import conformal_fregre_np

result = conformal_fregre_np(
    fd_train.data, train_response, fd_test.data, fd_train.argvals,
    cal_fraction=0.25,
    alpha=0.1,
    h_func=1.0,
    h_scalar=1.0,
    seed=42,
)

actual_coverage = np.mean((test_response >= result["lower"]) &
                          (test_response <= result["upper"]))
print(f"NP conformal coverage: {actual_coverage:.0%}")
print(f"Mean interval width:   {np.mean(result['upper'] - result['lower']):.4f}")
| Parameter | Default | Description |
|---|---|---|
h_func |
1.0 | Functional bandwidth |
h_scalar |
1.0 | Scalar bandwidth |
cal_fraction |
0.25 | Calibration fraction |
alpha |
0.1 | Miscoverage level |
Linear vs. nonparametric width
Conformal coverage is guaranteed regardless of the base model — but the base model determines how tight the intervals are. Whichever model best captures the predictor-response relationship produces the smallest calibration residuals and hence the narrowest intervals. The following simulation mimics near-infrared spectra with a localized absorption peak near \(t=0.4\) whose height drives the response, then compares the two base models at the same 90% level.
import numpy as np
from docs_fig import fig, render
from fdars.conformal import conformal_fregre_lm, conformal_fregre_np

np.random.seed(42)
n_train, n_test, m = 160, 40, 80
t = np.linspace(0, 1, m)

def make(n):
    raw = np.zeros((n, m))
    for i in range(n):
        baseline = 0.8 * np.sin(np.pi * t) + 0.3 * np.cos(2 * np.pi * t)
        peak_loc = 0.4 + 0.03 * np.random.randn()
        peak_h = 2.0 + 0.6 * np.random.randn()
        peak = np.exp(-((t - peak_loc) / 0.05) ** 2 / 2)     # unit-height Gaussian bump
        raw[i] = baseline + peak_h * peak + 0.08 * np.random.randn(m)
    beta_true = np.exp(-((t - 0.4) / 0.06) ** 2 / 2)
    y = np.trapezoid(raw * beta_true, t, axis=1) + 0.15 * np.random.randn(n)
    return raw, y

Xtr, ytr = make(n_train)
Xte, yte = make(n_test)

lm = conformal_fregre_lm(Xtr, ytr, Xte, ncomp=5, cal_fraction=0.25, alpha=0.10, seed=42)
npr = conformal_fregre_np(Xtr, ytr, Xte, t, cal_fraction=0.25, alpha=0.10,
                          h_func=1.0, h_scalar=1.0, seed=42)

def summary(res):
    lo, hi = np.asarray(res["lower"]), np.asarray(res["upper"])
    cov = float(np.mean((yte >= lo) & (yte <= hi)))
    return hi - lo, cov

w_lm, c_lm = summary(lm)
w_np, c_np = summary(npr)

f, ax = fig()
ax.boxplot([w_lm, w_np],
           tick_labels=[f"linear\n(cov {c_lm*100:.0f}%)", f"nonparametric\n(cov {c_np*100:.0f}%)"])
ax.set(title="Conformal interval width by base model (90% nominal)",
       ylabel="interval width")
ax.set_ylim(0, max(w_lm.max(), w_np.max()) * 1.1)
print(render(f))
Both models cover at or above the 90% target, and here the two are nearly tied on width — the nonparametric base is fractionally tighter. Because the peak-height signal is a mildly nonlinear feature, the flexible kernel model tracks it slightly better and pays no width penalty. When the predictor-response relationship is genuinely linear the ranking typically reverses; the practical lesson is to compare widths directly rather than assume one base model always wins.
Conformal classification
Produces prediction sets for classification: a set of possible labels for each test observation, with guaranteed marginal coverage.
import numpy as np
from fdars import Fdata
from fdars.conformal import conformal_classif

# --- Simulate three-class data ---
np.random.seed(7)
n_train, n_test = 150, 30
m = 101
t = np.linspace(0, 1, m)

templates = [
    np.sin(2 * np.pi * t),
    np.cos(2 * np.pi * t),
    np.sin(4 * np.pi * t),
]

def make_classif_data(n):
    raw = np.zeros((n, m))
    labels = np.zeros(n, dtype=np.int64)
    for i in range(n):
        k = i % 3
        raw[i] = templates[k] + 0.4 * np.random.randn(m)
        labels[i] = k
    fd = Fdata(raw, argvals=t)
    return fd, labels

fd_train, train_labels = make_classif_data(n_train)
fd_test, test_labels = make_classif_data(n_test)

result = conformal_classif(
    fd_train.data, train_labels, fd_test.data,
    ncomp=3,
    classifier="lda",
    cal_fraction=0.25,
    alpha=0.1,
    seed=42,
)

pred_sets = result["prediction_sets"]  # list of lists
coverage  = result["coverage"]

# Inspect prediction sets
for i in range(min(5, n_test)):
    correct = test_labels[i] in pred_sets[i]
    print(f"  Test {i}: set={pred_sets[i]}, true={test_labels[i]}, "
          f"covered={'yes' if correct else 'NO'}")

actual_coverage = np.mean([test_labels[i] in pred_sets[i] for i in range(n_test)])
print(f"\nTarget coverage:   {1 - 0.1:.0%}")
print(f"Empirical coverage: {actual_coverage:.0%}")
print(f"Mean set size:      {np.mean([len(s) for s in pred_sets]):.2f}")
| Key | Type | Description |
|---|---|---|
prediction_sets |
list[list[int]] |
Prediction set for each test observation |
coverage |
float |
Reported coverage |
| Parameter | Default | Description |
|---|---|---|
classifier |
"lda" |
Base classifier: "lda", "qda", or "knn" |
ncomp |
3 | Number of FPC components |
cal_fraction |
0.25 | Calibration fraction |
alpha |
0.1 | Miscoverage level |
Interpreting prediction set sizes
- Set size = 1: the model is confident about a single class.
- Set size > 1: ambiguity -- multiple classes are plausible at the specified confidence level.
- Empty set: can occur in rare edge cases; indicates the calibration set was too small.
The coverage guarantee applies to prediction sets exactly as it does to intervals. Sweeping \(\alpha\) and averaging over independent splits, the empirical label-coverage should track the \(1-\alpha\) diagonal, while the mean set size is the classification analogue of interval width — the efficiency metric that measures how much ambiguity the method retains.
import numpy as np
from docs_fig import fig, render
from fdars.conformal import conformal_classif

m = 101
t = np.linspace(0, 1, m)
templates = [np.sin(2 * np.pi * t), np.cos(2 * np.pi * t), np.sin(4 * np.pi * t)]

def make(n, rng):
    raw = np.zeros((n, m))
    lab = np.zeros(n, dtype=np.int64)
    for i in range(n):
        k = i % 3
        raw[i] = templates[k] + 1.4 * rng.standard_normal(m)
        lab[i] = k
    return raw, lab

alphas = [0.02, 0.05, 0.10, 0.20]
mean_cov, mean_size = [], []
for a in alphas:
    covs, sizes = [], []
    for rep in range(15):
        rng = np.random.default_rng(rep)
        Xtr, ytr = make(240, rng)
        Xte, yte = make(120, rng)
        r = conformal_classif(Xtr, ytr, Xte, ncomp=3, classifier="lda",
                              cal_fraction=0.3, alpha=a, seed=rep)
        ps = r["prediction_sets"]
        covs.append(np.mean([yte[i] in ps[i] for i in range(len(yte))]))
        sizes.append(np.mean([len(s) for s in ps]))
    mean_cov.append(np.mean(covs)); mean_size.append(np.mean(sizes))

targets = [1 - a for a in alphas]
f, ax = fig()
ax.plot(targets, mean_cov, "o-", color="#198754", label="empirical coverage")
ax.plot([0.75, 1], [0.75, 1], color="#6c757d", ls="--", lw=1, label="target = 1 - alpha")
ax.set(title="Conformal classification coverage tracks the target",
       xlabel=r"target coverage $1-\alpha$", ylabel="empirical label coverage")
ax2 = ax.twinx()
ax2.plot(targets, mean_size, "s--", color="#7b2d8e", alpha=0.7, label="mean set size")
ax2.set_ylabel("mean prediction-set size", color="#7b2d8e")
ax.legend(loc="upper left", fontsize=8)
print(render(f))
Empirical label coverage lands right on the diagonal at every level, confirming the split-conformal guarantee transfers verbatim to prediction sets. The mean set size (purple) grows as the coverage demand tightens — buying a stronger guarantee costs larger, less decisive label sets, exactly mirroring the width penalty seen in the regression case.
Practical considerations
Choosing cal_fraction
The calibration fraction controls the bias-variance trade-off:
- Larger calibration set (e.g., 0.3--0.5): tighter, more accurate coverage but the model is trained on less data.
- Smaller calibration set (e.g., 0.1--0.2): more training data but wider intervals and noisier coverage.
A common choice is cal_fraction=0.25. The sweep below makes the trade-off visible: coverage
holds at the target across the whole range (the guarantee does not depend on the split ratio),
while the variability of coverage and the mean width respond to how the data is partitioned.
import numpy as np
from docs_fig import fig, render
from fdars.conformal import conformal_fregre_lm

m = 70
t = np.linspace(0, 1, m)
beta_true = np.exp(-((t - 0.5) ** 2) / 0.02)

def make(n, rng):
    raw = np.zeros((n, m))
    for i in range(n):
        raw[i] = sum(rng.standard_normal() * np.sin((2 * k + 1) * np.pi * t)
                     for k in range(4)) + 0.2 * rng.standard_normal(m)
    y = np.trapezoid(raw * beta_true, t, axis=1) + 0.4 * rng.standard_normal(n)
    return raw, y

fracs = [0.10, 0.20, 0.30, 0.40, 0.50]
mean_cov, sd_cov, mean_w = [], [], []
for frac in fracs:
    cs, ws = [], []
    for rep in range(25):
        rng = np.random.default_rng(500 + rep)
        Xtr, ytr = make(200, rng)
        Xte, yte = make(80, rng)
        r = conformal_fregre_lm(Xtr, ytr, Xte, ncomp=4, cal_fraction=frac,
                                alpha=0.10, seed=rep)
        lo, hi = np.asarray(r["lower"]), np.asarray(r["upper"])
        cs.append(float(np.mean((yte >= lo) & (yte <= hi))))
        ws.append(float(np.mean(hi - lo)))
    mean_cov.append(np.mean(cs)); sd_cov.append(np.std(cs)); mean_w.append(np.mean(ws))

f, ax = fig()
ax.errorbar(fracs, mean_cov, yerr=sd_cov, fmt="o-", color="#198754",
            capsize=3, label="empirical coverage +/- sd")
ax.axhline(0.90, color="#6c757d", ls="--", lw=1, label="target 0.90")
ax.set(title="cal_fraction: coverage stable, variability shrinks with more calibration",
       xlabel="cal_fraction", ylabel="empirical coverage")
ax2 = ax.twinx()
ax2.plot(fracs, mean_w, "s--", color="#7b2d8e", alpha=0.7, label="mean width")
ax2.set_ylabel("mean interval width", color="#7b2d8e")
ax.legend(loc="lower right", fontsize=8)
print(render(f))
Coverage sits on the 0.90 line for every split, but the error bars tighten as more data is
reserved for calibration — larger calibration sets estimate the nonconformity quantile more
precisely. The width (purple) drifts up slightly because the model sees less training data, so
cal_fraction=0.25 is a sensible compromise between stable coverage and a well-trained model.
Choosing alpha
alpha |
Coverage target | Typical use case |
|---|---|---|
| 0.01 | 99% | Safety-critical applications |
| 0.05 | 95% | Standard scientific inference |
| 0.10 | 90% | Exploratory analysis |
| 0.20 | 80% | Screening / ranking |
As \(\alpha\) shrinks, the guarantee tightens and the intervals must widen to keep up. Sweeping \(\alpha\) makes the trade-off concrete: empirical coverage tracks the \(1-\alpha\) target while the mean width grows monotonically.
import numpy as np
from docs_fig import fig, render
from fdars.conformal import conformal_fregre_lm

np.random.seed(123)
n_train, n_test, m = 200, 60, 80
t = np.linspace(0, 1, m)
beta_true = np.exp(-((t - 0.5) ** 2) / 0.02)

def make(n):
    raw = np.zeros((n, m))
    for i in range(n):
        raw[i] = sum(np.random.randn() * np.sin((2 * k + 1) * np.pi * t)
                     for k in range(4)) + 0.2 * np.random.randn(m)
    y = np.trapezoid(raw * beta_true, t, axis=1) + 0.4 * np.random.randn(n)
    return raw, y

Xtr, ytr = make(n_train)
Xte, yte = make(n_test)

alphas = [0.02, 0.05, 0.10, 0.20]
cov, width = [], []
for a in alphas:
    r = conformal_fregre_lm(Xtr, ytr, Xte, ncomp=4, cal_fraction=0.25, alpha=a, seed=42)
    lo, hi = np.asarray(r["lower"]), np.asarray(r["upper"])
    cov.append(float(np.mean((yte >= lo) & (yte <= hi))))
    width.append(float(np.mean(hi - lo)))

targets = [1 - a for a in alphas]
f, ax = fig()
ax.plot(targets, cov, "o-", color="#198754", label="empirical coverage")
ax.plot([min(targets), 1], [min(targets), 1], color="#6c757d", ls="--", lw=1,
        label="target = 1 - alpha")
ax.set(title="Coverage tracks the target as alpha varies",
       xlabel=r"target coverage $1-\alpha$", ylabel="empirical coverage")
ax2 = ax.twinx()
ax2.plot(targets, width, "s--", color="#7b2d8e", alpha=0.7, label="mean width")
ax2.set_ylabel("mean interval width", color="#7b2d8e")
ax.legend(loc="upper left", fontsize=8)
print(render(f))
Coverage stays on or above the diagonal at every level, and the widths (purple) climb as the guarantee tightens — the price of higher confidence.
Full example: comparing conformal methods
import numpy as np
from fdars import Fdata
from fdars.conformal import conformal_fregre_lm, conformal_fregre_np

np.random.seed(123)
n_train, n_test, m = 300, 100, 81
t = np.linspace(0, 1, m)
beta_true = np.exp(-((t - 0.5)**2) / 0.02)

def make_data(n):
    raw = np.zeros((n, m))
    for i in range(n):
        raw[i] = sum(
            np.random.randn() * np.sin((2*k+1) * np.pi * t)
            for k in range(4)
        ) + 0.2 * np.random.randn(m)
    fd = Fdata(raw, argvals=t)
    resp = np.trapz(fd.data * beta_true, fd.argvals, axis=1) + 0.4 * np.random.randn(n)
    return fd, resp

fd_train, train_resp = make_data(n_train)
fd_test, test_resp = make_data(n_test)

for alpha in [0.05, 0.10, 0.20]:
    # Linear conformal
    lm = conformal_fregre_lm(
        fd_train.data, train_resp, fd_test.data,
        ncomp=4, cal_fraction=0.25, alpha=alpha,
    )
    cov_lm = np.mean((test_resp >= lm["lower"]) & (test_resp <= lm["upper"]))
    width_lm = np.mean(lm["upper"] - lm["lower"])

    # Nonparametric conformal
    np_r = conformal_fregre_np(
        fd_train.data, train_resp, fd_test.data, fd_train.argvals,
        cal_fraction=0.25, alpha=alpha,
    )
    cov_np = np.mean((test_resp >= np_r["lower"]) & (test_resp <= np_r["upper"]))
    width_np = np.mean(np_r["upper"] - np_r["lower"])

    print(f"alpha={alpha:.2f} | LM: cov={cov_lm:.0%} width={width_lm:.3f} | "
          f"NP: cov={cov_np:.0%} width={width_np:.3f}")
See also
- Uncertainty quantification — bootstrap/analytic bands; contrast with the finite-sample guarantee here.
- Conformal classification — the same split-conformal machinery for label sets.
- Cross-validation — honest error estimation feeding the nonconformity scores.
References
- Vovk, V., Gammerman, A., & Shafer, G. (2005). Algorithmic Learning in a Random World. Springer.
- Barber, R. F., Candès, E. J., Ramdas, A., & Tibshirani, R. J. (2021). Predictive inference with the jackknife+. Annals of Statistics, 49(1), 486–507.
- Romano, Y., Patterson, E., & Candès, E. (2019). Conformalized quantile regression. Advances in Neural Information Processing Systems, 32.
- Lei, J., G'Sell, M., Rinaldo, A., Tibshirani, R. J., & Wasserman, L. (2018). Distribution-free predictive inference for regression. Journal of the American Statistical Association, 113(523), 1094–1111.