Robust Regression
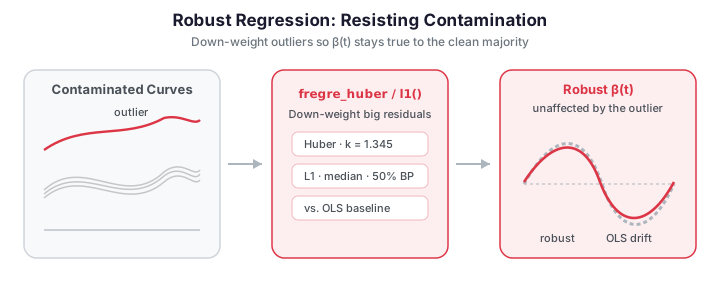
Standard FPC regression (fregre_lm) uses ordinary least squares, which is sensitive to outliers in the response. Robust regression methods replace the squared loss with loss functions that down-weight extreme residuals, yielding estimators that resist contamination.
fdars provides two robust alternatives:
| Method | Loss function | Breakdown point | Notes |
|---|---|---|---|
| L1 regression | \(\lvert r \rvert\) | 50% | Median regression; completely ignores outlier magnitude |
| Huber M-estimation | Quadratic near 0, linear in tails | Depends on \(k\) | Smooth compromise between L2 and L1 |
Which method should I use?
- Start with OLS (
fregre_lm) — it is the most efficient estimator when the data are clean and gives you the full diagnostic ecosystem. - If you suspect outliers, fit Huber — the default \(k=1.345\) keeps 95% of OLS's efficiency on clean Gaussian data, so it costs almost nothing to hedge.
- For severe contamination (more than ~10-15%), switch to L1, which trades a little clean-data efficiency for maximum outlier resistance.
Setup: clean vs. contaminated spectra
We simulate curves built from four smooth modes whose amplitudes drive the response, \(y = 2\,a_1 - 1.5\,a_2 + \varepsilon\), so the true coefficient is \(\beta(t) \propto 2\phi_1(t) - 1.5\phi_2(t)\) and is recoverable when the fit is not corrupted. Then we contaminate 15% of the responses with one-sided positive shifts of 5-15 units — the kind of damage a saturating sensor produces.
import numpy as np
from docs_fig import fig, render

np.random.seed(42)
n, m = 120, 81
t = np.linspace(0, 1, m)
amp = np.random.randn(n, 4)
raw = np.zeros((n, m))
for i in range(n):
    raw[i] = sum(amp[i, k] * np.sin((2 * k + 1) * np.pi * t)
                 for k in range(4)) + 0.1 * np.random.randn(m)

y_clean = 2.0 * amp[:, 0] - 1.5 * amp[:, 1] + 0.3 * np.random.randn(n)
y_contam = y_clean.copy()
outliers = np.random.choice(n, int(0.15 * n), replace=False)
y_contam[outliers] += np.random.uniform(5, 15, size=len(outliers))

is_out = np.zeros(n, bool)
is_out[outliers] = True

f, ax = fig()
ax.scatter(y_clean[~is_out], y_contam[~is_out], color="#2e8b57", s=28, alpha=0.7,
           label="clean")
ax.scatter(y_clean[is_out], y_contam[is_out], color="#d55e00", s=40, alpha=0.9,
           label="outlier")
lim = [y_clean.min(), y_clean.max()]
ax.plot(lim, lim, color="#6c757d", ls="--", lw=1)
ax.set(title="Clean vs. contaminated responses",
       xlabel="clean y", ylabel="contaminated y")
ax.legend()
print(render(f))
The 15% of points lifted above the diagonal are the contamination the robust methods must resist.
Coefficient recovery under contamination
With 15% of the responses corrupted, the OLS estimate of \(\beta(t)\) is dragged toward the outliers, while L1 and Huber stay close to the truth. Correlation with the true \(\beta(t)\) makes this quantitative.
import numpy as np
from docs_fig import fig, render
from fdars.regression import fregre_lm, fregre_l1, fregre_huber

np.random.seed(42)
n, m = 120, 81
t = np.linspace(0, 1, m)
amp = np.random.randn(n, 4)
raw = np.zeros((n, m))
for i in range(n):
    raw[i] = sum(amp[i, k] * np.sin((2 * k + 1) * np.pi * t)
                 for k in range(4)) + 0.1 * np.random.randn(m)
y_clean = 2.0 * amp[:, 0] - 1.5 * amp[:, 1] + 0.3 * np.random.randn(n)
y_contam = y_clean.copy()
outliers = np.random.choice(n, int(0.15 * n), replace=False)
y_contam[outliers] += np.random.uniform(5, 15, size=len(outliers))

beta_true = 2.0 * np.sin(np.pi * t) - 1.5 * np.sin(3 * np.pi * t)
beta_true /= np.abs(beta_true).max()

ols = fregre_lm(raw, y_contam, n_comp=5)
l1 = fregre_l1(raw, y_contam, n_comp=5)
hub = fregre_huber(raw, y_contam, n_comp=5, huber_k=1.345)

def scaled(b):
    b = np.asarray(b)
    return b / np.abs(b).max()

f, ax = fig()
ax.plot(t, beta_true, color="#6c757d", lw=2, ls="--", label=r"true $\beta(t)$")
ax.plot(t, scaled(ols["beta_t"]), color="#dc3545", lw=2, label="OLS")
ax.plot(t, scaled(l1["beta_t"]), color="#3f51b5", lw=2, label="L1")
ax.plot(t, scaled(hub["beta_t"]), color="#198754", lw=2, label="Huber")
ax.set(title="Coefficient estimates under 15% response contamination (scaled)",
       xlabel="t", ylabel=r"$\beta(t)$ (unit max)")
ax.legend()
print(render(f))
import numpy as np
from fdars.regression import fregre_lm, fregre_l1, fregre_huber

np.random.seed(42)
n, m = 120, 81
t = np.linspace(0, 1, m)
amp = np.random.randn(n, 4)
raw = np.zeros((n, m))
for i in range(n):
    raw[i] = sum(amp[i, k] * np.sin((2 * k + 1) * np.pi * t)
                 for k in range(4)) + 0.1 * np.random.randn(m)
y_clean = 2.0 * amp[:, 0] - 1.5 * amp[:, 1] + 0.3 * np.random.randn(n)
y_contam = y_clean.copy()
outliers = np.random.choice(n, int(0.15 * n), replace=False)
y_contam[outliers] += np.random.uniform(5, 15, size=len(outliers))
beta_true = 2.0 * np.sin(np.pi * t) - 1.5 * np.sin(3 * np.pi * t)

def corr(b):
    return abs(np.corrcoef(beta_true, np.asarray(b))[0, 1])

c = {}
for name, fn, kw in [("OLS", fregre_lm, {}), ("L1", fregre_l1, {}),
                     ("Huber", fregre_huber, {"huber_k": 1.345})]:
    fit = fn(raw, y_contam, n_comp=5, **kw)
    c[name] = corr(fit["beta_t"])
    print(f"{name:6s} corr(beta_hat, beta_true) = {c[name]:.3f}")

# Validation: robust fits stay faithful to the true beta under 15% contamination,
# while OLS is dragged off by the outliers.
assert c["L1"] > 0.9 and c["Huber"] > 0.9, c        # robust methods recover beta(t)
assert c["OLS"] < 0.6, c                            # OLS collapses under contamination
assert min(c["L1"], c["Huber"]) - c["OLS"] > 0.3, c # clear robustness gap
print("validation OK: L1/Huber corr > 0.9 while OLS collapses (< 0.6)")
OLS corr(beta_hat, beta_true) = 0.192 L1 corr(beta_hat, beta_true) = 0.974 Huber corr(beta_hat, beta_true) = 0.948 validation OK: L1/Huber corr > 0.9 while OLS collapses (< 0.6)
The printed correlations tell the story: OLS's estimate barely resembles the truth, while L1 and Huber recover it almost intact. (The clean-data fit reaches \(R^2 \approx 0.98\) for all three; the gap only opens once the outliers are added.) The assertions make this quantitative: the two robust fits stay above a 0.9 correlation with the true \(\beta(t)\) while OLS drops below 0.6.
L1 regression
L1 (least absolute deviations) regression minimizes \(\sum_i |y_i - \hat{y}_i|\) instead of \(\sum_i (y_i - \hat{y}_i)^2\). This is equivalent to estimating the conditional median rather than the conditional mean.
import numpy as np
from fdars import Fdata
from fdars.regression import fregre_l1

# --- Simulate data with outliers ---
np.random.seed(42)
n, m = 100, 81
t = np.linspace(0, 1, m)
beta_true = np.sin(4 * np.pi * t)

raw = np.zeros((n, m))
for i in range(n):
    raw[i] = (
        np.random.randn() * np.sin(2 * np.pi * t)
        + np.random.randn() * np.cos(2 * np.pi * t)
        + 0.2 * np.random.randn(m)
    )
fd = Fdata(raw, argvals=t)

response = np.trapz(fd.data * beta_true, fd.argvals, axis=1) + 0.3 * np.random.randn(n)

# Add 10% outliers
n_outliers = 10
outlier_idx = np.random.choice(n, n_outliers, replace=False)
response[outlier_idx] += 10 * np.random.randn(n_outliers)

# --- Fit L1 regression ---
result = fregre_l1(fd.data, response, n_comp=3)

fitted  = result["fitted_values"]  # (n,)
resid   = result["residuals"]      # (n,)
beta_l1 = result["beta_t"]         # (m,) -- estimated beta(t)

print(f"L1 median absolute residual: {np.median(np.abs(resid)):.4f}")
| Key | Type | Description |
|---|---|---|
fitted_values |
ndarray (n,) |
Fitted values |
residuals |
ndarray (n,) |
Residuals |
beta_t |
ndarray (m,) |
Estimated coefficient function |
Huber M-estimation
Huber regression uses the Huber loss, which behaves like squared error for small residuals and like absolute error for large residuals:
The tuning constant \(k\) controls the transition point. The default \(k = 1.345\) gives 95% efficiency relative to OLS when the errors are truly Gaussian.
from fdars.regression import fregre_huber

result = fregre_huber(fd.data, response, n_comp=3, huber_k=1.345)

fitted     = result["fitted_values"]  # (n,)
resid      = result["residuals"]      # (n,)
beta_huber = result["beta_t"]         # (m,)

print(f"Huber median absolute residual: {np.median(np.abs(resid)):.4f}")
| Key | Type | Description |
|---|---|---|
fitted_values |
ndarray (n,) |
Fitted values |
residuals |
ndarray (n,) |
Residuals |
beta_t |
ndarray (m,) |
Estimated coefficient function |
| Parameter | Default | Description |
|---|---|---|
n_comp |
3 | Number of FPC components |
huber_k |
1.345 | Huber tuning constant |
Choosing huber_k
huber_k |
Behavior | Efficiency (Gaussian) |
|---|---|---|
| 0.5 | Very robust, low efficiency | ~60% |
| 1.0 | Moderate robustness | ~89% |
| 1.345 | Standard choice | ~95% |
| 2.0 | Mild robustness | ~99% |
| \(\to \infty\) | Equivalent to OLS | 100% |
How robustness works: IRLS weights
Both robust fits are solved by iteratively reweighted least squares: at each iteration every observation gets a weight \(w_i = \psi(r_i)/r_i\) that shrinks as its residual grows, and a weighted OLS step is taken. The weight functions are
Huber leaves small-residual points at full weight (1) and tapers only the tails; L1 down-weights everything by the inverse residual, pushing hardest on the outliers. Reconstructing the final Huber weights from the returned residuals shows the mechanism directly: the contaminated points are driven to near-zero weight.
import numpy as np
from docs_fig import fig, render
from fdars.regression import fregre_huber

np.random.seed(42)
n, m = 120, 81
t = np.linspace(0, 1, m)
amp = np.random.randn(n, 4)
raw = np.zeros((n, m))
for i in range(n):
    raw[i] = sum(amp[i, k] * np.sin((2 * k + 1) * np.pi * t)
                 for k in range(4)) + 0.1 * np.random.randn(m)
y_clean = 2.0 * amp[:, 0] - 1.5 * amp[:, 1] + 0.3 * np.random.randn(n)
y_contam = y_clean.copy()
outliers = np.random.choice(n, int(0.15 * n), replace=False)
y_contam[outliers] += np.random.uniform(5, 15, size=len(outliers))

hub = fregre_huber(raw, y_contam, n_comp=5, huber_k=1.345)
resid = np.asarray(hub["residuals"])

# Reconstruct the final Huber IRLS weights from the residuals.
k = 1.345
scale = 1.4826 * np.median(np.abs(resid - np.median(resid)))    # robust scale (MAD)
w = np.minimum(1.0, k * scale / np.abs(resid))

is_out = np.zeros(n, bool)
is_out[outliers] = True

f, ax = fig()
ax.scatter(np.where(~is_out)[0], w[~is_out], color="#2e8b57", s=24, alpha=0.7,
           label="clean")
ax.scatter(np.where(is_out)[0], w[is_out], color="#d55e00", s=44, alpha=0.9,
           label="outlier")
ax.set(title="Reconstructed Huber IRLS weights",
       xlabel="observation", ylabel="weight")
ax.legend()
print(render(f))
Clean observations cluster near weight 1; the outliers collapse toward 0, which is exactly why their upward shift cannot drag the fit.
Weights are reconstructed, not returned
The R fregre.huber/fregre.l1 return the IRLS weights, iterations and converged
flag directly; the Python bindings currently return only fitted_values, residuals and
beta_t. The weights above are recomputed from the returned residuals using the Huber
weight function and a MAD scale estimate — the same quantity, made explicit.
Comparing OLS, L1, and Huber
import numpy as np
import pandas as pd
from fdars import Fdata
from fdars.regression import fregre_lm, fregre_l1, fregre_huber

np.random.seed(0)
n, m = 120, 101
t = np.linspace(0, 1, m)
beta_true = np.exp(-((t - 0.5)**2) / 0.02)

# Clean data
raw = np.zeros((n, m))
for i in range(n):
    raw[i] = sum(
        np.random.randn() * np.sin((2*k+1) * np.pi * t)
        for k in range(4)
    ) + 0.15 * np.random.randn(m)
fd = Fdata(raw, argvals=t)

response_clean = np.trapz(fd.data * beta_true, fd.argvals, axis=1) + 0.3 * np.random.randn(n)

# Contaminated response (15% outliers)
response = response_clean.copy()
contaminated = np.random.choice(n, int(0.15 * n), replace=False)
response[contaminated] += 8 * np.random.choice([-1, 1], size=len(contaminated))

# --- Fit all three ---
ols   = fregre_lm(fd.data, response, n_comp=4)
l1    = fregre_l1(fd.data, response, n_comp=4)
huber = fregre_huber(fd.data, response, n_comp=4, huber_k=1.345)

# --- Evaluate beta recovery and prediction on clean observations ---
clean_idx = np.setdiff1d(np.arange(n), contaminated)
rows = []
for name, res in [("OLS", ols), ("L1", l1), ("Huber", huber)]:
    corr = np.corrcoef(beta_true, res["beta_t"])[0, 1]
    mse = np.mean((res["fitted_values"][clean_idx] - response_clean[clean_idx])**2)
    rows.append({"method": name, "beta_corr": corr, "mse_clean": mse})

results_df = pd.DataFrame(rows)
print(results_df.to_string(index=False))
The clearest view is observed-vs-predicted on the clean observations after training on contaminated data: OLS's cloud is tilted and shifted by the outliers it chased, while L1 and Huber stay close to the 1:1 line.
import numpy as np
from docs_fig import fig, render
from fdars.regression import fregre_lm, fregre_l1, fregre_huber

np.random.seed(42)
n, m = 120, 81
t = np.linspace(0, 1, m)
amp = np.random.randn(n, 4)
raw = np.zeros((n, m))
for i in range(n):
    raw[i] = sum(amp[i, k] * np.sin((2 * k + 1) * np.pi * t)
                 for k in range(4)) + 0.1 * np.random.randn(m)
y_clean = 2.0 * amp[:, 0] - 1.5 * amp[:, 1] + 0.3 * np.random.randn(n)
y_contam = y_clean.copy()
outliers = np.random.choice(n, int(0.15 * n), replace=False)
y_contam[outliers] += np.random.uniform(5, 15, size=len(outliers))
clean_idx = np.setdiff1d(np.arange(n), outliers)

fits = [("OLS", fregre_lm(raw, y_contam, n_comp=5)),
        ("L1", fregre_l1(raw, y_contam, n_comp=5)),
        ("Huber", fregre_huber(raw, y_contam, n_comp=5, huber_k=1.345))]

f, axes = fig(ncols=3, figsize=(11, 3.4))
for (name, fit), ax in zip(fits, axes):
    pred = np.asarray(fit["fitted_values"])[clean_idx]
    obs = y_clean[clean_idx]
    ax.scatter(obs, pred, color="#4a90d9", s=20, alpha=0.7)
    lim = [obs.min(), obs.max()]
    ax.plot(lim, lim, color="#6c757d", ls="--", lw=1)
    ax.set(title=name, xlabel="true (clean) y", ylabel="predicted")
f.suptitle("Observed vs. predicted on clean points (trained on contaminated data)", y=1.03)
print(render(f))
The OLS panel is visibly tilted and offset — its predictions on clean points are biased by the outliers it chased during fitting — whereas the L1 and Huber clouds hug the 1:1 line, confirming that down-weighting the tails preserves accuracy where it matters.
The loss and weight functions side by side
The whole story reduces to how each method scores a residual. Plotting the three loss functions \(\rho(r)\) and their IRLS weight functions \(w(r)=\psi(r)/r\) over a common residual axis makes the trade-off concrete:
import numpy as np
from docs_fig import fig, render

r = np.linspace(-6, 6, 400)
k = 1.345
loss_ols = 0.5 * r ** 2
loss_l1 = np.abs(r)
loss_hub = np.where(np.abs(r) <= k, 0.5 * r ** 2, k * np.abs(r) - 0.5 * k ** 2)

eps = 1e-6
w_ols = np.ones_like(r)
w_l1 = 1.0 / np.maximum(np.abs(r), eps)
w_hub = np.minimum(1.0, k / np.maximum(np.abs(r), eps))

f, (a0, a1) = fig(ncols=2, figsize=(11, 3.8))
a0.plot(r, loss_ols, color="#dc3545", lw=2, label="OLS  ½r²")
a0.plot(r, loss_l1, color="#3f51b5", lw=2, label="L1  |r|")
a0.plot(r, loss_hub, color="#198754", lw=2, label=fr"Huber  (k={k})")
a0.axvspan(-k, k, color="#198754", alpha=0.08)
a0.set(title="Loss functions ρ(r)", xlabel="residual r", ylabel="ρ(r)", ylim=(0, 12))
a0.legend()

a1.plot(r, w_ols, color="#dc3545", lw=2, label="OLS")
a1.plot(r, w_l1, color="#3f51b5", lw=2, label="L1")
a1.plot(r, w_hub, color="#198754", lw=2, label="Huber")
a1.axvspan(-k, k, color="#198754", alpha=0.08)
a1.set(title="IRLS weights w(r)", xlabel="residual r", ylabel="w(r)", ylim=(0, 1.1))
a1.legend()
print(render(f))
OLS grows quadratically forever and weights every point equally, so a single large residual dominates the fit; Huber switches to a linear tail outside the shaded band \(|r|\le k\) and caps its weight there; L1 is linear everywhere and its weight decays like \(1/|r|\), the most aggressive down-weighting of the three.
When to use robust methods
| Scenario | Recommendation |
|---|---|
| Clean data, no outliers | fregre_lm (OLS) -- most efficient |
| Suspected outliers in response | fregre_huber with default \(k=1.345\) |
| Known heavy contamination (\(>10\%\)) | fregre_l1 |
| Outliers in predictors (leverage points) | Pre-filter with outlier detection, then use any method |
| Heteroscedastic errors | fregre_huber with smaller \(k\) (e.g., 1.0) |
Warning
Robust methods protect against outliers in the response \(y_i\). They do not guard against leverage points (outlying \(x_i(t)\)). For high-leverage outliers, consider depth-based trimming before fitting.
See also
- Scalar-on-function regression — the OLS baseline these methods harden.
- Regression diagnostics — locate the influential points before down-weighting them.
- Outlier detection — depth-based screening for leverage points.
References
- Huber, P. J. (1964). Robust estimation of a location parameter. Annals of Mathematical Statistics, 35(1), 73–101.
- Huber, P. J., & Ronchetti, E. M. (2009). Robust Statistics (2nd ed.). Wiley.
- Maronna, R. A., Martin, R. D., Yohai, V. J., & Salibián-Barrera, M. (2019). Robust Statistics: Theory and Methods (2nd ed.). Wiley.
- Cardot, H., Crambes, C., & Sarda, P. (2005). Quantile regression when the covariates are functions. Journal of Nonparametric Statistics, 17(7), 841–856.