Distance Metrics
Distance (and dissimilarity) measures between curves are fundamental building blocks for clustering, classification, nonparametric regression, and outlier detection. fdars provides a comprehensive set of metrics -- from classical \(L^p\) norms to elastic distances that factor out time warping.
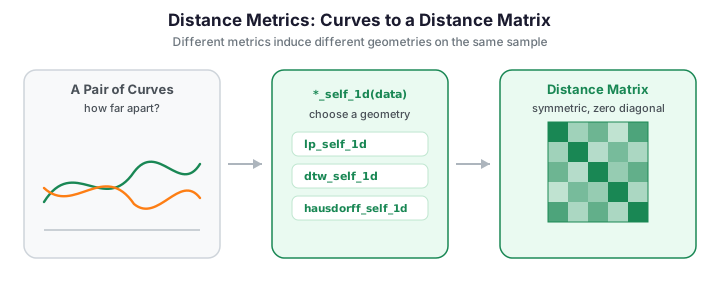
Self vs cross distances
Every metric comes in two flavors:
| Variant | Signature | Output shape | Description |
|---|---|---|---|
| self | *_self_1d(data, ...) |
\((n, n)\) | Pairwise distances within one sample |
| cross | *_cross_1d(data1, data2, ...) |
\((n_1, n_2)\) | Distances between two samples |
Both return a NumPy array. Self-distance matrices are symmetric with zeros on the diagonal.
Different metrics induce different geometries on the same sample. Below, four self-distance matrices are computed on a set of curves (half of which are randomly time-shifted). Note how \(L^2\) and Hausdorff see the shifted curves as far apart, while DTW -- which absorbs local time warping -- pulls them back together.
import numpy as np
from docs_fig import fig, render
from fdars.simulation import simulate
from fdars.metric import lp_self_1d, dtw_self_1d, hausdorff_self_1d, fourier_self_1d

rng = np.random.default_rng(123)
t = np.linspace(0, 1, 120)
X = np.asarray(simulate(n=24, argvals=t, n_basis=3, seed=123))
for i in range(12, 24):                       # time-shift half the sample
    X[i] = np.roll(X[i], int(rng.integers(-12, 12)))

mats = [
    ("$L^2$", np.asarray(lp_self_1d(X, t, p=2.0))),
    ("DTW (w=12)", np.asarray(dtw_self_1d(X, p=2.0, w=12))),
    ("Hausdorff", np.asarray(hausdorff_self_1d(X, t))),
    ("Fourier", np.asarray(fourier_self_1d(X, n_basis=7))),
]

f, axes = fig(1, 4, figsize=(12, 3.2))
for ax, (name, D) in zip(axes, mats):
    im = ax.imshow(D, cmap="viridis", aspect="equal")
    ax.set(title=name, xticks=[], yticks=[])
    f.colorbar(im, ax=ax, fraction=0.046, pad=0.04)
print(render(f))
The \(L^2\) and Hausdorff panels show a bright block for the shifted half of the sample -- these metrics read a time shift as a large distance. The DTW panel is comparatively uniform: by warping the time axis it collapses those same shifted pairs back toward the bulk, and the Fourier panel sits in between.
\(L^p\) distances
The most common functional distances, defined as
with numerical integration via the trapezoidal rule.
import numpy as np
from fdars import Fdata

argvals = np.linspace(0, 1, 200)

# Assuming `data` is a numpy array of curves, wrap it in Fdata
fd = Fdata(data, argvals=argvals)

# L2 distance (default)
D_l2 = fd.distance(method="lp", p=2.0)

# L1 distance (more robust to spikes)
D_l1 = fd.distance(method="lp", p=1.0)

# L-infinity (supremum norm)
D_linf = fd.distance(method="lp", p=float('inf'))
| Parameter | Default | Description |
|---|---|---|
data |
(required) | Curves, shape (n, m) |
argvals |
(required) | Evaluation grid, length m |
p |
2.0 |
\(L^p\) exponent. Use float('inf') for the sup norm |
Cross distance example
# Distance between training and test curves
D_cross = lp_cross_1d(train_data, test_data, argvals, p=2.0)
print(D_cross.shape)  # (n_train, n_test)
2D variants
For surface data observed on a product grid:
from fdars.metric import lp_self_2d, lp_cross_2d

D_2d = lp_self_2d(surface_data, argvals_s, argvals_t, p=2.0)
Hausdorff distance
The Hausdorff distance treats each curve as a set of points in \((t, X(t))\) space and measures the worst-case mismatch:
from fdars.metric import hausdorff_self_1d, hausdorff_cross_1d

D_haus = hausdorff_self_1d(data, argvals)
| Property | Value |
|---|---|
| Metric | Yes (true metric) |
| Shift invariant | No |
| Robust to phase variation | Somewhat |
When to use Hausdorff
Hausdorff distance is useful when curves have different support or when you care about the worst-case pointwise discrepancy. It is less sensitive to small localized differences than \(L^2\).
2D variants
Dynamic Time Warping (DTW)
DTW finds the optimal nonlinear alignment between two sequences that minimizes the total cost. Unlike \(L^p\) distances, DTW is invariant to local time shifts.
where \(\pi\) is a monotone warping path.
from fdars.metric import dtw_self_1d, dtw_cross_1d

# Unconstrained DTW
D_dtw = dtw_self_1d(data, p=2.0)

# With Sakoe-Chiba band (limits warping to w grid points)
D_dtw_sc = dtw_self_1d(data, p=2.0, w=10)
| Parameter | Default | Description |
|---|---|---|
p |
2.0 |
Cost exponent |
w |
0 |
Sakoe-Chiba band width. 0 = no constraint (full warping) |
Sakoe-Chiba band
Setting w to a small value (e.g., 5-20 % of the sequence length) serves two purposes:
- Speed -- constrains the DP search from \(O(m^2)\) to \(O(m \cdot w)\).
- Prevents pathological warps -- disallows extreme temporal distortions.
To see why DTW matters, take a curve and a time-shifted copy of it. Pointwise \(L^2\) reports a large distance because peaks no longer line up vertically; DTW re-aligns the time axis first and reports a much smaller value.
The two curves are identical up to a horizontal shift, yet the title shows the \(L^2\) distance is several times larger than the DTW distance. \(L^2\) penalises the vertical mismatch created by the misaligned peaks, while DTW first re-aligns the time axis and so reports the small residual difference that remains.
Soft-DTW
Soft-DTW replaces the hard min in DTW with a differentiable soft-minimum, making it suitable as a loss function for gradient-based optimization.
where \(\mathrm{soft\text{-}min}^{\gamma}\) uses the log-sum-exp with smoothing parameter \(\gamma\).
from fdars.metric import soft_dtw_self_1d, soft_dtw_cross_1d

D_sdtw = soft_dtw_self_1d(data, gamma=1.0)
| Parameter | Default | Description |
|---|---|---|
gamma |
1.0 |
Smoothing parameter. As \(\gamma \to 0\), Soft-DTW \(\to\) DTW |
Soft-DTW is not a metric
Soft-DTW does not satisfy the triangle inequality. If you need a proper metric, use the Soft-DTW divergence instead:
from fdars.metric import soft_dtw_div_self_1d, soft_dtw_div_cross_1d

D_div = soft_dtw_div_self_1d(data, gamma=1.0)
The divergence is defined as \(\tilde{d}_{\gamma}(X, Y) = d_{\gamma}(X, Y) - \frac{1}{2}\bigl[d_{\gamma}(X, X) + d_{\gamma}(Y, Y)\bigr]\) and is non-negative with zero diagonal.
Effect of the smoothing parameter \(\gamma\)
The parameter \(\gamma\) trades sharpness for smoothness: small \(\gamma\) approaches hard DTW (a single best warping path), large \(\gamma\) averages over many paths. Sweeping it for a fixed curve pair shows the divergence changing smoothly with \(\gamma\) on a log scale.
import numpy as np
from docs_fig import fig, render
from fdars.simulation import simulate
from fdars.metric import soft_dtw_div_self_1d

t = np.linspace(0, 1, 80)
base = np.asarray(simulate(n=1, argvals=t, n_basis=4, efun_type="fourier", seed=5))[0]
pair = np.vstack([base, np.roll(base, 8)])         # a curve and a shifted copy

gammas = np.array([0.01, 0.03, 0.1, 0.3, 1.0, 3.0, 10.0])
div = np.array([float(np.asarray(soft_dtw_div_self_1d(pair, gamma=g))[0, 1])
                for g in gammas])

f, ax = fig()
ax.plot(gammas, div, "o-", color="#3f51b5")
ax.set(title="Soft-DTW divergence vs smoothing parameter $\\gamma$",
       xlabel="$\\gamma$ (log scale)", ylabel="divergence", xscale="log")
print(render(f))
The divergence varies smoothly and monotonically as \(\gamma\) sweeps across three orders of magnitude: at small \(\gamma\) it tends to the hard-DTW value (a single best path), and it decreases as \(\gamma\) grows and the soft-minimum averages over an increasingly wide set of warping paths.
Fourier coefficient distance
Compares curves through their Fourier representations. Two curves are close if their first n_basis Fourier coefficients are similar.
where \(\hat{X}, \hat{Y} \in \mathbb{R}^{n_{\text{basis}}}\) are truncated Fourier coefficient vectors.
from fdars.metric import fourier_self_1d, fourier_cross_1d

D_fourier = fourier_self_1d(data, n_basis=5)
| Parameter | Default | Description |
|---|---|---|
n_basis |
5 |
Number of Fourier coefficients to compare |
| Property | Value |
|---|---|
| Metric | Yes |
| Shift invariant | Depends on n_basis |
| Best for | Periodic data, frequency-domain comparison |
Horizontal shift distance
Finds the uniform horizontal shift that best aligns two curves and reports the residual:
from fdars.metric import hshift_self_1d, hshift_cross_1d

D_shift = hshift_self_1d(data, argvals, max_shift=0)
| Parameter | Default | Description |
|---|---|---|
max_shift |
0 |
Maximum shift in grid points. 0 = \(m/4\) |
| Property | Value |
|---|---|
| Metric | Semimetric (triangle inequality may fail) |
| Shift invariant | Yes (by construction) |
| Best for | Data with simple horizontal misalignment |
Elastic distances
The elastic (Fisher-Rao) framework separates amplitude (vertical) and phase (horizontal) variation via the Square Root Slope Function (SRSF) transform. These distances live in the fdars.alignment module.
Elastic distance
The total elastic distance combines amplitude and phase:
Amplitude distance
Measures only the vertical shape difference after optimal alignment:
Phase distance
Measures only the warping needed to align two curves:
Elastic distance matrices
For pairwise computations across a full sample:
from fdars.alignment import elastic_self_distance_matrix, elastic_cross_distance_matrix

D_elastic = elastic_self_distance_matrix(data, argvals, lambda_=0.0)
D_cross   = elastic_cross_distance_matrix(train_data, test_data, argvals)
| Parameter | Default | Description |
|---|---|---|
lambda_ |
0.0 |
Regularization -- penalizes extreme warping |
Performance
Elastic distance matrices require \(O(n^2)\) pairwise alignments, each involving a dynamic programming step. For large datasets, consider using a subset or the Sakoe-Chiba-constrained DTW as a faster alternative.
Amplitude and phase capture orthogonal variation
Amplitude and phase distances describe complementary aspects of dissimilarity: two curves can have the same shape but different timing (small amplitude, large phase) or different shapes at matched timing (large amplitude, small phase). Plotting the pairwise amplitude distance against the pairwise phase distance for a sample -- half of which is time-shifted -- shows the two axes are only weakly related.
import numpy as np
from docs_fig import fig, render
from fdars.simulation import simulate
from fdars.alignment import (amplitude_self_distance_matrix,
                             phase_self_distance_matrix)

rng = np.random.default_rng(0)
t = np.linspace(0, 1, 80)
X = np.asarray(simulate(n=20, argvals=t, n_basis=3, seed=1))
for i in range(10, 20):                            # time-shift half the sample
    X[i] = np.roll(X[i], int(rng.integers(-8, 8)))

Damp = np.asarray(amplitude_self_distance_matrix(X, t))
Dph = np.asarray(phase_self_distance_matrix(X, t))
iu = np.triu_indices(X.shape[0], k=1)
amp, phase = Damp[iu], Dph[iu]

f, ax = fig(figsize=(6, 5))
ax.scatter(amp, phase, s=18, color="#3f51b5", alpha=0.6)
ax.axvline(amp.mean(), ls="--", color="#6c757d", lw=1)
ax.axhline(phase.mean(), ls="--", color="#6c757d", lw=1)
ax.set(title="Amplitude vs phase pairwise distances",
       xlabel="amplitude distance", ylabel="phase distance")
print(render(f))
The point cloud has no clear diagonal trend: pairs with large phase distance are spread across the whole range of amplitude distance and vice versa. This confirms the two coordinates are nearly orthogonal -- amplitude captures shape difference, phase captures timing difference, and they carry largely independent information.
Which metrics see phase? A correlation view
Metrics that ignore time warping (L2, L1, Hausdorff) rank pairs somewhat differently from ones that absorb it (DTW). Computing several distance matrices on a phase-varying sample and correlating their off-diagonal entries makes the structure visible: L2 and L1 agree almost perfectly, DTW correlates highly with them (it still tracks amplitude, only discounting phase), and Hausdorff -- caring about worst-case pointwise mismatch -- sits furthest apart.
import numpy as np
from docs_fig import fig, render
from fdars.simulation import simulate
from fdars.metric import lp_self_1d, dtw_self_1d, hausdorff_self_1d

rng = np.random.default_rng(0)
t = np.linspace(0, 1, 80)
X = np.asarray(simulate(n=24, argvals=t, n_basis=3, seed=1))
for i in range(12, 24):
    X[i] = np.roll(X[i], int(rng.integers(-8, 8)))

iu = np.triu_indices(X.shape[0], k=1)
mats = {
    "L2": np.asarray(lp_self_1d(X, t, p=2.0))[iu],
    "L1": np.asarray(lp_self_1d(X, t, p=1.0))[iu],
    "DTW": np.asarray(dtw_self_1d(X, p=2.0, w=10))[iu],
    "Hausdorff": np.asarray(hausdorff_self_1d(X, t))[iu],
}
names = list(mats)
C = np.corrcoef(np.vstack([mats[n] for n in names]))

f, ax = fig(figsize=(5, 4.5))
im = ax.imshow(C, cmap="viridis", vmin=0, vmax=1)
ax.set(xticks=range(len(names)), yticks=range(len(names)),
       xticklabels=names, yticklabels=names,
       title="Correlation of pairwise distances")
for i in range(len(names)):
    for j in range(len(names)):
        ax.text(j, i, f"{C[i, j]:.2f}", ha="center", va="center",
                color="white" if C[i, j] < 0.7 else "black", fontsize=9)
f.colorbar(im, ax=ax, fraction=0.046, pad=0.04)
print(render(f))
The heatmap confirms the narrative: the L2-L1 cell is near 1.0 (they rank pairs almost identically), DTW correlates strongly with both because it still tracks amplitude, and the Hausdorff row/column shows the lowest correlations -- its worst-case pointwise view of dissimilarity is the odd one out.
Metric properties comparison
| Metric | True metric | Shift invariant | Scale invariant | Handles phase variation | Speed |
|---|---|---|---|---|---|
| \(L^p\) | Yes | No | No | No | Very fast |
| Hausdorff | Yes | No | No | Partially | Fast |
| DTW | Yes | No | No | Yes | Moderate |
| Soft-DTW | No | No | No | Yes | Moderate |
| Soft-DTW Divergence | Semi | No | No | Yes | Moderate |
| Fourier | Yes | Partially | No | No | Fast |
| Horizontal Shift | Semi | Yes | No | Yes (rigid) | Moderate |
| Elastic (Fisher-Rao) | Yes | No | No | Yes (optimal) | Slow |
| Amplitude | Semi | No | No | Yes | Slow |
| Phase | Yes | No | No | Yes | Slow |
Method selection guide
Is your data periodic?
  YES --> Fourier coefficient distance
  NO  --> continue

Is there significant horizontal misalignment?
  NO  --> L2 distance (fast, standard choice)
  YES --> continue

Is the misalignment a simple global shift?
  YES --> Horizontal shift distance
  NO  --> continue

Do you need a true metric?
  YES --> DTW (with Sakoe-Chiba band) or Elastic distance
  NO  --> Soft-DTW (differentiable, good for optimization)

Do you need amplitude/phase decomposition?
  YES --> Elastic framework (amplitude_distance + phase_distance)
  NO  --> DTW is simpler and faster
Complete example: comparing metrics
import numpy as np
import matplotlib.pyplot as plt
from fdars import Fdata
from fdars.simulation import simulate
from fdars.metric import dtw_self_1d, hausdorff_self_1d, fourier_self_1d

# --- 1. Simulate data with phase variation --------------------------------
argvals = np.linspace(0, 1, 150)
data = simulate(n=30, argvals=argvals, n_basis=3, seed=123)

# Add random horizontal shifts to half the curves
shifted_data = data.copy()
for i in range(15, 30):
    shift = np.random.randint(-10, 10)
    shifted_data[i] = np.roll(data[i], shift)
fd = Fdata(shifted_data, argvals=argvals)

# --- 2. Compute distance matrices ----------------------------------------
D_l2      = fd.distance(method="lp", p=2.0)
D_dtw     = dtw_self_1d(fd.data, p=2.0, w=15)
D_haus    = hausdorff_self_1d(fd.data, fd.argvals)
D_fourier = fourier_self_1d(fd.data, n_basis=7)

# --- 3. Visualize --------------------------------------------------------
fig, axes = plt.subplots(1, 4, figsize=(18, 4))

for ax, D, name in zip(axes,
                        [D_l2, D_dtw, D_haus, D_fourier],
                        ["L2", "DTW (w=15)", "Hausdorff", "Fourier"]):
    im = ax.imshow(D, cmap="viridis", aspect="auto")
    ax.set_title(name)
    plt.colorbar(im, ax=ax, fraction=0.046)

plt.suptitle("Distance matrix comparison")
plt.tight_layout()
plt.show()
Using distance matrices downstream
Distance matrices plug directly into several fdars methods:
from fdars.regression import fregre_np
from fdars.clustering import kmeans_fd

# Nonparametric kernel regression from distances
D = fd.distance(method="lp", p=2.0)
reg = fregre_np(D, response, h=0.0)  # h=0 -> automatic bandwidth

# Functional k-means also accepts precomputed distances
# (see the clustering documentation)
API summary
fdars.metric
| Function | Key parameters | Description |
|---|---|---|
lp_self_1d(data, argvals, p) |
p=2.0 |
\(L^p\) self distances |
lp_cross_1d(data1, data2, argvals, p) |
p=2.0 |
\(L^p\) cross distances |
lp_self_2d(data, argvals_s, argvals_t, p) |
p=2.0 |
\(L^p\) self for surfaces |
lp_cross_2d(...) |
p=2.0 |
\(L^p\) cross for surfaces |
hausdorff_self_1d(data, argvals) |
-- | Hausdorff self |
hausdorff_cross_1d(data1, data2, argvals) |
-- | Hausdorff cross |
hausdorff_self_2d(data, argvals_s, argvals_t) |
-- | Hausdorff self for surfaces |
hausdorff_cross_2d(...) |
-- | Hausdorff cross for surfaces |
dtw_self_1d(data, p, w) |
p=2.0, w=0 |
DTW self |
dtw_cross_1d(data1, data2, p, w) |
p=2.0, w=0 |
DTW cross |
soft_dtw_self_1d(data, gamma) |
gamma=1.0 |
Soft-DTW self |
soft_dtw_cross_1d(data1, data2, gamma) |
gamma=1.0 |
Soft-DTW cross |
soft_dtw_div_self_1d(data, gamma) |
gamma=1.0 |
Soft-DTW divergence self |
soft_dtw_div_cross_1d(data1, data2, gamma) |
gamma=1.0 |
Soft-DTW divergence cross |
fourier_self_1d(data, n_basis) |
n_basis=5 |
Fourier coefficient self |
fourier_cross_1d(data1, data2, n_basis) |
n_basis=5 |
Fourier coefficient cross |
hshift_self_1d(data, argvals, max_shift) |
max_shift=0 |
Horizontal shift self |
hshift_cross_1d(data1, data2, argvals, max_shift) |
max_shift=0 |
Horizontal shift cross |
fdars.alignment (elastic distances)
| Function | Key parameters | Description |
|---|---|---|
elastic_distance(c1, c2, argvals, lambda_) |
lambda_=0.0 |
Pairwise elastic distance |
amplitude_distance(c1, c2, argvals, lambda_) |
lambda_=0.0 |
Amplitude component only |
phase_distance(c1, c2, argvals, lambda_) |
lambda_=0.0 |
Phase component only |
elastic_self_distance_matrix(data, argvals, lambda_) |
lambda_=0.0 |
Full elastic distance matrix |
elastic_cross_distance_matrix(d1, d2, argvals, lambda_) |
lambda_=0.0 |
Cross elastic distance matrix |
amplitude_self_distance_matrix(data, argvals, lambda_) |
lambda_=0.0 |
Amplitude distance matrix |
phase_self_distance_matrix(data, argvals, lambda_) |
lambda_=0.0 |
Phase distance matrix |
shape_distance(c1, c2, argvals, lambda_) |
lambda_=0.0 |
Shape distance (reparameterization-invariant) |
shape_self_distance_matrix(data, argvals, quotient, lambda_) |
quotient="reparameterization" |
Shape distance matrix |
Binding differences vs the R reference
The Python fdars.metric does not expose the R vignette's Kullback-Leibler distance or the PCA / derivative / basis / FFT semimetrics; the closest available pieces are fourier_self_1d (a truncated-coefficient distance) and building a basis/PCA distance yourself from basis coefficients or FPC scores. Unlike the R page, the Python shape_self_distance_matrix returns the same value for quotient="reparameterization" and quotient="scale" on the examples tested, so scale is not factored out here -- use it as a reparameterization-invariant shape distance only.
References
- Berndt, D.J. and Clifford, J. (1994). Using Dynamic Time Warping to find patterns in time series. KDD Workshop, 359-370.
- Cuturi, M. and Blondel, M. (2017). Soft-DTW: a differentiable loss function for time-series. ICML 34, 894-903.
- Ferraty, F. and Vieu, P. (2006). Nonparametric Functional Data Analysis. Springer.
- Sakoe, H. and Chiba, S. (1978). Dynamic programming algorithm optimization for spoken word recognition. IEEE TASSP 26(1), 43-49.
- Srivastava, A. and Klassen, E. (2016). Functional and Shape Data Analysis. Springer.