Elastic Regression
Standard scalar-on-function regression assumes the functional predictors are observed on a common, meaningful time scale. When curves carry phase variability (differences in the timing of features), least-squares methods blend amplitude and phase variation: the FPCs waste directions on the misalignment, \(\hat\beta(t)\) gets blurred, and predictive accuracy collapses.
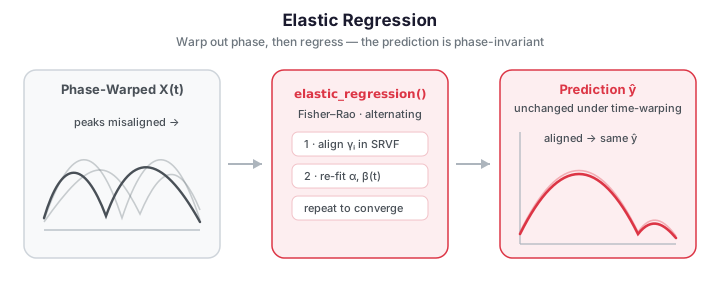
Elastic regression fixes this by jointly estimating warping functions \(\gamma_i\) and a coefficient function \(\beta(t)\) under the Fisher–Rao metric, working in the square-root-velocity (SRVF) domain where phase and amplitude separate cleanly.
Mathematical framework
Standard functional linear model
The scalar-on-function linear model regresses a scalar response on a functional predictor \(X_i(t)\), \(t \in [0,1]\):
This is what fregre_lm fits (via an FPCA basis
truncation). It is optimal only when the \(X_i\) are already registered —
i.e. corresponding features occur at the same \(t\) across curves.
Phase variability and the SRVF representation
Let \(\Gamma = \{\gamma:[0,1]\to[0,1] \mid \gamma(0)=0,\ \gamma(1)=1,\ \dot\gamma>0\}\) be the group of boundary-preserving diffeomorphisms (warping functions). A warped predictor is the composition \(\tilde X_i = X_i \circ \gamma_i\). The difficulty is that the ordinary \(\mathbb L^2\) distance is not invariant to warping — \(\|X\circ\gamma - Y\circ\gamma\| \neq \|X-Y\|\) — so registration under \(\mathbb L^2\) is ill-posed (the pinching problem).
The fix is to represent each curve by its square-root velocity function (SRVF):
The original curve is recovered (up to a constant) by \(X(t) = X(0) + \int_0^t q(s)\,\lvert q(s)\rvert\,ds\). The decisive property is that under warping the SRVF transforms as
and the \(\mathbb L^2\) distance between SRVFs is warping-invariant: \(\lVert (q_1,\gamma) - (q_2,\gamma)\rVert = \lVert q_1 - q_2\rVert\). The \(\mathbb L^2\) metric on SRVFs is exactly the Fisher–Rao metric pulled back to curve space — the unique reparameterization-invariant Riemannian metric. This is what makes the amplitude distance
a proper, phase-invariant notion of how different two curves are in shape, and
the residual phase distance \(d_p\) a measure of how much timing had to change
to achieve that match. In fdars the SRVF map is srsf_transform / its inverse
srsf_inverse, and the amplitude/phase split of a pair is elastic_decomposition.
Elastic regression model
Elastic regression embeds the warping directly into the linear model, treating phase as a nuisance to be optimised away:
The model is phase-invariant by construction: warping a predictor, \(X_i \mapsto X_i \circ \gamma\), is absorbed into \(\gamma_i\), leaving the prediction unchanged. Fitting minimises the residual sum of squares jointly over \((\alpha, \beta, \{\gamma_i\})\) by an alternating (block-coordinate) scheme, with a roughness penalty \(\lambda\) on the warping to prevent degenerate (pinched) \(\gamma_i\):
- Alignment step — fix \(\beta\), and for each \(i\) update \(\gamma_i = \arg\min_{\gamma\in\Gamma}\big(y_i - \alpha - \int \tilde X_i\beta\big)^2\) by dynamic programming in the SRVF domain (the response guides the warp).
- Regression step — fix \(\{\gamma_i\}\), form the aligned curves, and
re-estimate \(\alpha\) and \(\beta(t)\) by penalised least squares on an
ncomp_beta-dimensional FPCA basis.
Iterate until the relative change in SSE falls below tol (or max_iter is
reached). Because each step cannot increase the objective, the loss decreases
monotonically to a stationary point.
Elastic logistic model
For a binary response the same machinery applies to the log-odds:
with the regression step replaced by penalised logistic regression on the aligned FPCA scores.
Elastic principal component regression (PCR)
Instead of estimating \(\beta(t)\) directly, elastic PCR first performs elastic FPCA on the aligned curves and regresses the response on the resulting scores \(\xi_{ik}\):
There are three flavours of score, depending on which variation you keep:
vertical (amplitude only, vert_fpca), horizontal (phase only, via the
shooting vectors of the warps, horiz_fpca), and joint (a balanced
combination, joint_fpca).
When alignment actually matters
The key scenario is: the response is driven by an amplitude feature, and phase is pure nuisance. The worked example below (ported from the R reference) makes this precise. Every curve is a nonlinearly time-warped copy of one template, scaled by a random amplitude perturbation \(\delta_i\); the response depends only on \(\delta_i\):
Because the informative signal (\(\delta_i\)) lives in amplitude while the dominant variance is phase, ordinary FPC regression latches onto the warping and fails. Elastic regression aligns the phase away and recovers the amplitude signal.
import numpy as np
from scipy.stats import beta as beta_dist
from docs_fig import fig, render
from fdars.regression import fregre_lm
from fdars.alignment import elastic_regression

rng = np.random.default_rng(42)
n, m = 60, 80
t = np.linspace(0, 1, m)

def template(s):
    return np.sin(2 * np.pi * s) + 0.3 * np.sin(6 * np.pi * s)

def random_warp(rng, t):
    # A nonlinear, monotone warp of [0,1] onto itself: a Beta CDF.
    a, b = rng.uniform(0.5, 2.0, size=2)
    return beta_dist.cdf(t, a, b)

X = np.zeros((n, m))
y = np.zeros(n)
for i in range(n):
    gamma = random_warp(rng, t)
    delta = rng.normal(0, 0.4)                      # amplitude signal
    X[i] = (1 + 0.2 * delta) * np.interp(gamma, t, template(t)) \
           + 0.1 * rng.standard_normal(m)
    y[i] = 2 * delta + rng.normal(0, 0.3)           # response depends on delta

lm = fregre_lm(X, y, n_comp=5)
el = elastic_regression(X, t, y, ncomp_beta=5, lambda_=0.01, max_iter=20, tol=1e-3)

f, (a0, a1) = fig(1, 2, figsize=(11, 4))
a0.plot(t, X[:20].T, color="#3f51b5", lw=0.7, alpha=0.4)
a0.set(title="Predictors: warped copies of one template", xlabel="t", ylabel="X(t)")

for name, res, c in [(f"standard FPC (R²={lm['r_squared']:.2f})", lm["fitted_values"], "#dc3545"),
                     (f"elastic (R²={el['r_squared']:.2f})", el["fitted_values"], "#198754")]:
    a1.scatter(y, np.asarray(res), s=26, alpha=0.75, color=c, label=name)
lim = [y.min(), y.max()]
a1.plot(lim, lim, color="#6c757d", ls="--", lw=1.5)
a1.set(title="Observed vs fitted", xlabel="observed y", ylabel="fitted y")
a1.legend(fontsize=8)
print(render(f))
Standard FPC regression explains almost none of the response, while elastic regression recovers it: the misalignment that dominated the raw curves is removed before fitting.
The SRVF domain: where phase and amplitude separate
The engine underneath every elastic method is the SRVF transform. Raw curves
that differ mostly in timing look wildly spread out; their SRVFs collapse
toward a common shape once the (multiplicative) warping term is factored out.
The plot below shows the raw predictors and their SRVFs srsf_transform(X_i, t).
import numpy as np
from scipy.stats import beta as beta_dist
from docs_fig import fig, render
from fdars.alignment import srsf_transform, karcher_mean

rng = np.random.default_rng(42)
n, m = 60, 80
t = np.linspace(0, 1, m)

def template(s):
    return np.sin(2 * np.pi * s) + 0.3 * np.sin(6 * np.pi * s)

X = np.zeros((n, m))
for i in range(n):
    a, b = rng.uniform(0.5, 2.0, size=2)
    gamma = beta_dist.cdf(t, a, b)
    delta = rng.normal(0, 0.4)
    X[i] = (1 + 0.2 * delta) * np.interp(gamma, t, template(t)) \
           + 0.1 * rng.standard_normal(m)

q = np.array([np.asarray(srsf_transform(X[i], t)) for i in range(n)])
km = karcher_mean(X, t, lambda_=0.01)          # Fisher-Rao Karcher mean + alignment
aligned = np.asarray(km["aligned_data"])

f, (a0, a1, a2) = fig(1, 3, figsize=(13, 4))
a0.plot(t, X[:20].T, color="#3f51b5", lw=0.7, alpha=0.5)
a0.set(title="Raw curves  X(t)", xlabel="t")
a1.plot(t, q[:20].T, color="#8e24aa", lw=0.7, alpha=0.5)
a1.set(title=r"SRVF domain  q(t)", xlabel="t")
a2.plot(t, aligned[:20].T, color="#198754", lw=0.7, alpha=0.5)
a2.plot(t, np.asarray(km["mean"]), color="#111", lw=2.2, label="Karcher mean")
a2.set(title="Aligned curves (phase removed)", xlabel="t")
a2.legend(fontsize=8)
print(render(f))
After Fisher–Rao alignment the curves overlap tightly around the Karcher mean; the remaining vertical spread is exactly the amplitude signal \(\delta_i\) that the response cares about.
Amplitude vs. phase distances
elastic_decomposition(f1, f2, argvals, lambda_) optimally aligns f2 to f1
and splits their total elastic distance into an amplitude part
(\(d_a\), shape difference in the SRVF domain) and a phase part
(\(d_p\), cost of the warp). Measuring each curve against the Karcher mean shows
how the two kinds of variation are distributed across the sample: here phase is
large and roughly constant (every curve is heavily warped), while the amplitude
distances carry what little of \(\lvert\delta_i\rvert\) survives the template and
noise (a weak proxy — the regression below extracts it far more cleanly).
import numpy as np
from scipy.stats import beta as beta_dist
from docs_fig import fig, render
from fdars.alignment import karcher_mean, elastic_decomposition

rng = np.random.default_rng(42)
n, m = 60, 80
t = np.linspace(0, 1, m)

def template(s):
    return np.sin(2 * np.pi * s) + 0.3 * np.sin(6 * np.pi * s)

X = np.zeros((n, m)); delta = np.zeros(n)
for i in range(n):
    a, b = rng.uniform(0.5, 2.0, size=2)
    gamma = beta_dist.cdf(t, a, b)
    delta[i] = rng.normal(0, 0.4)
    X[i] = (1 + 0.2 * delta[i]) * np.interp(gamma, t, template(t)) \
           + 0.1 * rng.standard_normal(m)

mu = np.asarray(karcher_mean(X, t, lambda_=0.01)["mean"])
d_amp = np.zeros(n); d_phase = np.zeros(n)
for i in range(n):
    dec = elastic_decomposition(mu, X[i], t, lambda_=0.01)
    d_amp[i], d_phase[i] = dec["d_amplitude"], dec["d_phase"]

f, (a0, a1) = fig(1, 2, figsize=(11, 4))
a0.scatter(d_phase, d_amp, s=30, c="#3f51b5", alpha=0.8)
a0.set(title="Phase vs. amplitude distance to the mean",
       xlabel=r"phase distance $d_p$", ylabel=r"amplitude distance $d_a$")
a1.scatter(np.abs(delta), d_amp, s=30, c="#198754", alpha=0.8)
a1.set(title=r"Amplitude distance vs. $|\delta_i|$",
       xlabel=r"$|\delta_i|$ (true amplitude signal)", ylabel=r"amplitude distance $d_a$")
print(render(f))
The right panel is a caution, not a victory lap: with only a 20% amplitude perturbation riding on a shared template plus noise, the raw amplitude distance to the mean is a weak, scattered proxy for \(|\delta_i|\) — a curve's distance to the Karcher mean mixes its own \(\delta_i\) with template and noise. The point of the elastic pipeline is not that this scatter is tight, but that a regression fit in the aligned/SRVF domain (below) recovers the \(\delta_i\) signal far more directly than one fit on the raw, phase-corrupted curves.
Elastic scalar-on-function regression
elastic_regression(data, argvals, response, ...) fits the joint model and
returns the intercept, aligned coefficient function, fit statistics, and the
estimated warping functions.
| Parameter | Type | Default | Description |
|---|---|---|---|
data |
ndarray (n, m) |
— | Predictor curves (one per row) |
argvals |
ndarray (m,) |
— | Common time grid \(t\) |
response |
ndarray (n,) |
— | Scalar response \(y\) |
ncomp_beta |
int |
10 |
FPCA basis dimension for \(\beta(t)\) |
lambda_ |
float |
0.0 |
Roughness penalty on the warpings |
max_iter |
int |
20 |
Max align/refit iterations |
tol |
float |
1e-4 |
Relative-SSE convergence tolerance |
import numpy as np
from scipy.stats import beta as beta_dist
from fdars import Fdata
from fdars.alignment import elastic_regression

# --- Simulate warped template + amplitude-driven response ---
rng = np.random.default_rng(42)
n, m = 60, 80
t = np.linspace(0, 1, m)

def template(s):
    return np.sin(2 * np.pi * s) + 0.3 * np.sin(6 * np.pi * s)

def random_warp(rng, t):
    a, b = rng.uniform(0.5, 2.0, size=2)       # Beta-CDF warp of [0,1]
    return beta_dist.cdf(t, a, b)

raw = np.zeros((n, m))
response = np.zeros(n)
for i in range(n):
    gamma = random_warp(rng, t)
    delta = rng.normal(0, 0.4)
    raw[i] = (1 + 0.2 * delta) * np.interp(gamma, t, template(t)) \
             + 0.1 * rng.standard_normal(m)
    response[i] = 2 * delta + rng.normal(0, 0.3)
fd = Fdata(raw, argvals=t)

# --- Fit elastic regression ---
result = elastic_regression(
    fd.data, fd.argvals, response,
    ncomp_beta=5,   # basis dimension for beta
    lambda_=0.01,   # regularization on warping
    max_iter=20,
    tol=1e-3,
)

alpha    = result["alpha"]           # intercept
beta     = result["beta"]            # (m,) -- estimated beta(t) in aligned space
fitted   = result["fitted_values"]   # (n,)
resid    = result["residuals"]       # (n,)
sse      = result["sse"]             # sum of squared errors
r2       = result["r_squared"]       # R-squared
gammas   = result["gammas"]          # (n, m) -- estimated warping functions
n_iter   = result["n_iter"]          # iterations used

print(f"R-squared:  {r2:.4f}")
print(f"Iterations: {n_iter}")
| Key | Type | Description |
|---|---|---|
alpha |
float |
Intercept |
beta |
ndarray (m,) |
Estimated coefficient function |
fitted_values |
ndarray (n,) |
Predicted response |
residuals |
ndarray (n,) |
Residuals |
sse |
float |
Sum of squared errors |
r_squared |
float |
Coefficient of determination |
gammas |
ndarray (n, m) |
Estimated warping functions |
n_iter |
int |
Number of iterations |
The two diagnostics that matter most are the estimated coefficient function \(\hat\beta(t)\) (interpretable only in the aligned domain) and the recovered warping functions \(\hat\gamma_i\) that carry all the phase:
import numpy as np
from scipy.stats import beta as beta_dist
from docs_fig import fig, render
from fdars.alignment import elastic_regression

rng = np.random.default_rng(42)
n, m = 60, 80
t = np.linspace(0, 1, m)

def template(s):
    return np.sin(2 * np.pi * s) + 0.3 * np.sin(6 * np.pi * s)

X = np.zeros((n, m)); y = np.zeros(n)
for i in range(n):
    a, b = rng.uniform(0.5, 2.0, size=2)
    gamma = beta_dist.cdf(t, a, b)
    delta = rng.normal(0, 0.4)
    X[i] = (1 + 0.2 * delta) * np.interp(gamma, t, template(t)) \
           + 0.1 * rng.standard_normal(m)
    y[i] = 2 * delta + rng.normal(0, 0.3)

el = elastic_regression(X, t, y, ncomp_beta=5, lambda_=0.01, max_iter=20, tol=1e-3)
beta = np.asarray(el["beta"]); gammas = np.asarray(el["gammas"])

f, (a0, a1) = fig(1, 2, figsize=(11, 4))
a0.plot(t, beta, color="#198754", lw=2)
a0.axhline(0, color="#6c757d", ls="--", lw=1)
a0.set(title=r"Estimated coefficient function $\hat\beta(t)$",
       xlabel="t (aligned)", ylabel=r"$\hat\beta(t)$")
a1.plot(t, gammas[:25].T, color="#e8710a", lw=0.8, alpha=0.6)
a1.plot([0, 1], [0, 1], color="#111", ls="--", lw=1.2, label="identity")
a1.set(title=r"Estimated warping functions $\hat\gamma_i$",
       xlabel="t", ylabel=r"$\gamma_i(t)$")
a1.legend(fontsize=8)
print(render(f))
The left panel shows the recovered coefficient function on the aligned time axis, where the signal is concentrated and no longer smeared by phase noise. The right panel reveals the estimated warping functions bending away from the diagonal identity — each curve's departure from the dashed line is exactly the time-warp the model removed before regressing, which is why elastic regression can find structure that a phase-blind linear fit misses.
Comparison with standard regression
Elastic regression outperforms fregre_lm when the predictors carry
substantial phase variability. If curves are already well aligned, the two
give similar results and fregre_lm is much faster.
Elastic logistic regression
For binary classification under phase variability. The model jointly aligns the curves and estimates the decision boundary in the aligned (SRVF) domain:
Continuing the example above, we threshold the response at its median to make a binary label. Elastic logistic recovers the classes with high accuracy because the amplitude sign that determines the label survives alignment, while the phase nuisance is removed.
import numpy as np
from fdars.alignment import elastic_logistic

labels = (response > np.median(response)).astype(np.int64)

result = elastic_logistic(
    fd.data, fd.argvals, labels,
    ncomp_beta=5,
    lambda_=0.01,
    max_iter=15,
    tol=1e-3,
)

probs     = result["probabilities"]       # (n,)
predicted = result["predicted_classes"]   # (n,)
accuracy  = result["accuracy"]            # scalar
beta      = result["beta"]                # (m,)
gammas    = result["gammas"]              # (n, m)
loss      = result["loss"]                # final loss value

print(f"Accuracy:   {accuracy:.2%}")
print(f"Final loss: {loss:.4f}")
| Key | Type | Description |
|---|---|---|
alpha |
float |
Intercept |
beta |
ndarray (m,) |
Coefficient function |
probabilities |
ndarray (n,) |
Predicted class probabilities |
predicted_classes |
ndarray (n,) |
Predicted labels |
accuracy |
float |
Classification accuracy |
loss |
float |
Final logistic loss |
gammas |
ndarray (n, m) |
Estimated warping functions |
n_iter |
int |
Number of iterations |
Elastic PCR: regressing on amplitude/phase scores
Elastic PCR replaces the direct \(\beta(t)\) estimate with a two-step recipe:
run elastic FPCA on the aligned curves, then regress \(y\) on the leading
scores. fdars exposes the three elastic-FPCA primitives — vert_fpca
(amplitude / vertical), horiz_fpca (phase / horizontal), and joint_fpca
(balanced) — each returning scores, eigenvalues, and cumulative_variance.
There is no packaged elastic.pcr binding in Python
The R reference ships a single elastic.pcr(fd, y, ncomp, pca.method=...)
wrapper. fdars' Python surface exposes the components but not the
wrapper, so we assemble PCR explicitly below: FPCA → ordinary least squares
on the scores. This is transparent and matches what the wrapper does
internally. The related conformal routine
fdars.conformal.conformal_elastic_pcr is bound if you need calibrated
prediction intervals.
A subtlety worth being honest about: the amplitude signal \(\delta_i\) here is a
low-variance direction, so the first few vert_fpca scores (ordered by
variance) capture template-shape variation before they reach \(\delta_i\). PCR
therefore needs enough components — or, equivalently, principal components of the
Karcher-aligned curves — before \(R^2\) climbs. The figure sweeps the number
of components for both score types.
import numpy as np
from numpy.linalg import lstsq
from scipy.stats import beta as beta_dist
from docs_fig import fig, render
from fdars.regression import fregre_lm
from fdars.alignment import vert_fpca, karcher_mean

rng = np.random.default_rng(42)
n, m = 60, 80
t = np.linspace(0, 1, m)

def template(s):
    return np.sin(2 * np.pi * s) + 0.3 * np.sin(6 * np.pi * s)

X = np.zeros((n, m)); y = np.zeros(n)
for i in range(n):
    a, b = rng.uniform(0.5, 2.0, size=2)
    gamma = beta_dist.cdf(t, a, b)
    delta = rng.normal(0, 0.4)
    X[i] = (1 + 0.2 * delta) * np.interp(gamma, t, template(t)) \
           + 0.1 * rng.standard_normal(m)
    y[i] = 2 * delta + rng.normal(0, 0.3)

def pcr_r2(scores):
    Z = np.column_stack([np.ones(n), scores])
    b, *_ = lstsq(Z, y, rcond=None)
    fit = Z @ b
    return 1 - ((y - fit) ** 2).sum() / ((y - y.mean()) ** 2).sum()

aligned = np.asarray(karcher_mean(X, t, lambda_=0.01)["aligned_data"])
ks = [2, 3, 4, 5, 6, 8]
r2_vert, r2_aligned = [], []
for k in ks:
    r2_vert.append(pcr_r2(np.asarray(vert_fpca(X, t, n_comp=k)["scores"])))
    Xc = aligned - aligned.mean(0)
    U, s, _ = np.linalg.svd(Xc, full_matrices=False)
    r2_aligned.append(pcr_r2(U[:, :k] * s[:k]))
r2_std = fregre_lm(X, y, n_comp=5)["r_squared"]

f, ax = fig()
ax.plot(ks, r2_vert, "o-", color="#8e24aa", label="vert_fpca scores")
ax.plot(ks, r2_aligned, "s-", color="#198754", label="PCA on aligned curves")
ax.axhline(r2_std, color="#dc3545", ls="--", lw=1.5, label=f"standard fregre_lm ({r2_std:.2f})")
ax.set(title="Elastic PCR: R² vs. number of components",
       xlabel="components K", ylabel=r"$R^2$", ylim=(0, 1))
ax.legend(fontsize=8)
print(render(f))
With enough components, PCR on the aligned curves recovers the amplitude signal and dwarfs the unaligned baseline; the raw vertical scores need more components to reach the same place because they rank the template shape above the weak \(\delta_i\) direction.
Align-then-regress: a cheaper alternative
Joint estimation is expensive. A pragmatic middle ground is to align the curves
once with karcher_mean (which returns aligned_data) and feed the aligned
curves into ordinary fregre_lm. Both alignment strategies dramatically beat the
unaligned baseline; which of the two wins depends on the data — align-then-regress
is a fast, strong default, while joint elastic optimisation lets the response
guide the warping.
import numpy as np
from scipy.stats import beta as beta_dist
from docs_fig import fig, render
from fdars.regression import fregre_lm
from fdars.alignment import elastic_regression, karcher_mean

rng = np.random.default_rng(42)
n, m = 60, 80
t = np.linspace(0, 1, m)

def template(s):
    return np.sin(2 * np.pi * s) + 0.3 * np.sin(6 * np.pi * s)

def random_warp(rng, t):
    a, b = rng.uniform(0.5, 2.0, size=2)
    return beta_dist.cdf(t, a, b)

X = np.zeros((n, m)); y = np.zeros(n)
for i in range(n):
    gamma = random_warp(rng, t)
    delta = rng.normal(0, 0.4)
    X[i] = (1 + 0.2 * delta) * np.interp(gamma, t, template(t)) \
           + 0.1 * rng.standard_normal(m)
    y[i] = 2 * delta + rng.normal(0, 0.3)

r_std = fregre_lm(X, y, n_comp=5)["r_squared"]
km = karcher_mean(X, t, lambda_=0.01)
r_align = fregre_lm(np.asarray(km["aligned_data"]), y, n_comp=5)["r_squared"]
r_elastic = elastic_regression(X, t, y, ncomp_beta=5, lambda_=0.01)["r_squared"]

methods = ["standard\nfregre_lm", "align-then\n-regress", "elastic\nregression"]
r2s = [r_std, r_align, r_elastic]

f, ax = fig()
ax.bar(methods, r2s, color=["#dc3545", "#e8710a", "#198754"], alpha=0.85)
for i, v in enumerate(r2s):
    ax.text(i, v + 0.01, f"{v:.2f}", ha="center", fontsize=10)
ax.set(title="R² by alignment strategy", ylabel=r"$R^2$", ylim=(0, 1))
print(render(f))
The bars rise from left to right: the phase-blind fregre_lm explains the least variance,
pre-aligning with the Karcher mean recovers a large chunk, and joint elastic regression edges
out even the two-step approach. The gap between the red and green bars is the concrete payoff of
warping the predictors — separating amplitude from phase turns a hard problem into a nearly
linear one.
When to use elastic regression
| Scenario | Recommended method |
|---|---|
| Predictors pre-aligned / no phase variability | fregre_lm, fregre_pls |
| Moderate phase shifts | elastic_regression with small \(\lambda\) |
| Large, nonlinear phase distortions | elastic_regression with moderate \(\lambda\) |
| Fast approximation for large \(n\) | align with karcher_mean, then fregre_lm |
| Interpretable amplitude/phase scores | elastic PCR via vert_fpca / horiz_fpca / joint_fpca |
| Binary classification with phase variability | elastic_logistic |
| Binary classification without phase variability | functional_logistic, fclassif_lda |
Computational cost
Elastic regression is far more expensive than standard functional regression
because it re-optimises the warping functions at every iteration. For large
datasets, pre-align once with karcher_mean and use fregre_lm.
Amplitude/phase attribution (R-only)
The R reference additionally documents elastic.attribution (permutation
importance of amplitude vs. phase). There is no single packaged fdars
Python binding for it. You can approximate it by permuting the vert_fpca
(amplitude) and horiz_fpca (phase) scores separately and measuring the drop
in \(R^2\), using the primitives shown above.
References
- Srivastava, A., Wu, W., Kurtek, S., Klassen, E. & Marron, J. S. (2011). Registration of functional data using the Fisher–Rao metric. arXiv:1103.3817.
- Tucker, J. D., Wu, W. & Srivastava, A. (2013). Generative models for functional data using phase and amplitude separation. Computational Statistics & Data Analysis, 61, 50–66.
- Srivastava, A. & Klassen, E. (2016). Functional and Shape Data Analysis. Springer.
- Ramsay, J. O. & Silverman, B. W. (2005). Functional Data Analysis, 2nd ed. Springer.