Per-Aspect Coverage
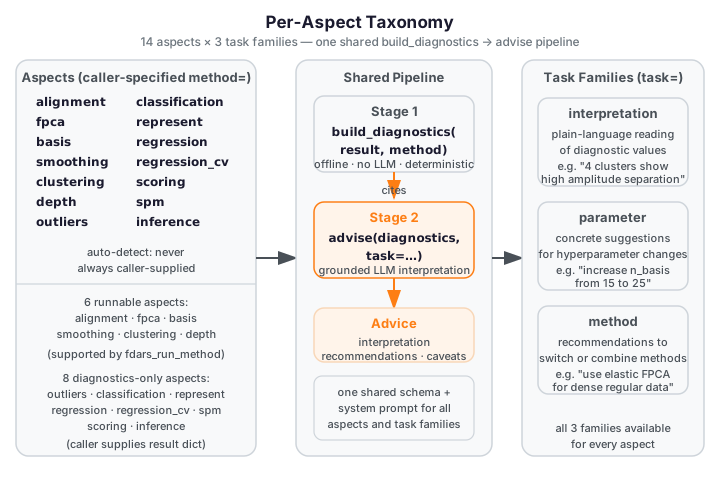
Every fdars analysis aspect follows the same two-stage treatment: an offline
deterministic build_diagnostics(result, method=…) report, then grounded
advise(…, task=…) task families. The aspect is always caller-specified —
build_diagnostics never auto-detects it from result keys.
The three task families available for every aspect are:
task= |
What you get |
|---|---|
"interpretation" |
Plain-language reading of the diagnostic values |
"parameter" |
Concrete suggestions for changing hyperparameters |
"method" |
Recommendations for switching or combining fdars methods |
Coverage Table
Aspect (method=) |
fdars source(s) | Key diagnostics (count) | Offline fence |
|---|---|---|---|
clustering |
fdars.clustering.kmeans_fd |
k, cluster_means, cluster_sizes, pairwise distances, separations (7) | python-api.md |
smoothing |
fdars.basis.smooth_basis_gcv, pspline_fit_gcv |
lambda sweep or single-fit GCV scalars (8) | — |
alignment |
fdars.alignment.karcher_mean, karcher_mean_elastic |
mean curve stats, amplitude/phase distances, convergence, registration-quality scores (17) | — |
basis |
fdars.basis.basis_nbasis_cv |
n_basis sweep, GCV curve, optimal n_basis (8) | — |
fpca |
fdars.regression.fpca, fdars.pace_fpca |
n_components, eigenvalues, cumulative variance, phase leakage; PACE branch: pace_ncomp, pace_sigma2, pace_variance_explained_cumulative (12) | this page |
fts |
fdars.fts.ftsm, fdars.fts.stationarity_test, fdars.fts.functional_acf, fdars.fts.dpca, fdars.fts.fplsr |
stationarity branch: has_stationarity, statistic, p_value, n_perm; acf branch: has_acf, n_lags, acf_at_lag1, acf_decay; dpca branch: has_dpca, dpca_ncomp, n_freqs, filter_lag, dpca_eigenvalues; fplsr branch: has_fplsr, fplsr_ncomp, fplsr_fitted_rmse; ftsm branch: has_ftsm, ncomp, n_obs, n_points, n_ar_models, ar_max_order, ar_sigma2_max, fitted_rmse; forecast branch: has_forecast, h, forecast_mean (28) | this page |
frechet |
fdars.frechet.frechet_mean, fdars.frechet.frechet_anova, fdars.frechet.frechet_global_reg, fdars.frechet.frechet_local_reg — diagnostics-only (not in _RUNNABLE_METHODS) |
frechet_mean branch: has_frechet_mean, frechet_mean_ndim, frechet_mean_dim, frechet_mean_trace; anova branch: has_anova, anova_p_value_permutation, anova_p_value_asymptotic, n_perm, n_groups, pooled_frechet_variance, group_frechet_variance_max; reg branch: has_global_reg, has_local_reg, predicted_n_obs, bandwidth (15) | — |
represent |
raw Fdata or {"data":…,"argvals":…} dict |
grid stats, data range, imputation-quality diagnostics (13) | — |
depth |
fdars.depth.* score arrays |
n_obs, depth statistics, histogram (9) | this page |
outliers |
fdars.outliers.* result dicts |
n_outliers, outlier_fraction, magnitude/shape/outliergram ranges; tvdmss: has_tvdmss + 7 keys; muod: has_muod + 9 keys; sequential_transform: has_sequential_transform + 2 keys; depthgram: has_depthgram + 6 keys (37) | — |
classification |
fdars.classification.* result dicts |
accuracy, cv_error_rate, fold_error_std, best_ncomp; elastic_multinomial branch: has_elastic_multinomial, train_accuracy, train_error_rate; shapelet_classifier branch: has_shapelet_classifier, shapelet_n_shapelets, shapelet_train_accuracy, shapelet_n_classes (13) | — |
regression |
fdars.regression.fregre_*, fosr, fosr_fpc, functional_glm, concurrent_regression, fof_regression, fof_re_regression; fdars.scalar_on_function.fam, fregre_gkam |
r_squared, residual stats, beta_t_range, has_fosr; GLM branch: has_functional_glm + 7 keys; concurrent branch: has_concurrent_regression + 3 keys; FoF branch: has_fof_regression, fof_r_squared, beta_surface_shape, beta_surface_max_abs, fof_ncomp; FoF-RE branch: has_fof_re_regression + 4 keys; FAM/GSAM branch: has_fam + 4 keys; GKAM branch: has_fregre_gkam + 3 keys (34) | — |
regression_cv |
fdars.regression.fregre_cv, model_selection_ncomp |
optimal_k, cv_curve, elbow_present (6) | — |
scoring |
fdars.scoring.functional_mae/mse/mape/msle/explained_variance |
five integrated prediction-quality scalars (5) | this page |
spm |
fdars.spm.spm_phase1, fdars.spm.mfpca, fdars.spm.spe_multivariate |
T², SPE stats, exceedance rates, eigenvalues, kurtosis check; mfpca branch: has_mfpca, mfpca_ncomp, mfpca_n_obs, mfpca_n_variables, mfpca_eigenvalues, mfpca_variance_explained_cumulative; spe_multivariate branch: has_spe_multivariate, spe_mv_n_obs, spe_mv_max, spe_mv_mean, spe_mv_all_nonneg (25) | — |
inference |
caller-supplied TestResult / ToleranceBand dict from fdars.inference (diagnostics-only) |
statistic, p_value, n_perm, significance flags, is_permutation_test (9) | this page |
clustering
fdars source: fdars.clustering.kmeans_fd
Returns a dict with centers, cluster, and k. Pass argvals to enable
amplitude/phase pairwise distances between cluster means.
| Key | Meaning |
|---|---|
method |
Always "clustering" |
k |
Number of clusters |
cluster_means |
List of k mean curves (each a list of floats) |
cluster_sizes |
Per-cluster observation counts |
pairwise_amplitude_distance |
k×k matrix of amplitude distances between cluster means; None when argvals absent |
pairwise_phase_distance |
k×k matrix of phase distances between cluster means; None when argvals absent |
mean_amplitude_separation |
Mean off-diagonal amplitude distance; None when argvals absent |
mean_phase_separation |
Mean off-diagonal phase distance; None when argvals absent |
Task families: "interpretation" (read cluster structure) · "parameter" (adjust k)
· "method" (switch to elastic alignment + clustering)
smoothing
fdars source: fdars.basis.smooth_basis_gcv, fdars.basis.pspline_fit_gcv
Two input shapes are handled. A lambda-sweep result (lambda_values + gcv keys in
the dict) fills the curve keys. A single-fit pspline_fit_gcv result fills only the
optimal_* scalars and leaves the curve keys None.
| Key | Meaning |
|---|---|
method |
Always "smoothing" |
lambda_values |
Lambda grid evaluated (list of floats); None for single-fit path |
gcv_curve |
GCV score at each lambda; None for single-fit path |
edf |
Effective degrees of freedom at each lambda; None for single-fit path |
gcv_aic_approx |
AIC-approximation curve (n·log(GCV) + 2·edf); None when edf absent |
gcv_bic_approx |
BIC-approximation curve (n·log(GCV) + log(n)·edf); None when edf absent |
optimal_lambda |
Lambda minimising GCV; None for single-fit path |
optimal_gcv |
GCV value at the optimal lambda (or the single-fit GCV) |
optimal_edf |
EDF at optimal lambda (or the single-fit EDF) |
Task families: "interpretation" (assess smoothing level) · "parameter" (adjust lambda range)
· "method" (switch smoother)
alignment
fdars source: fdars.alignment.karcher_mean, fdars.alignment.karcher_mean_elastic
Pass argvals to enable per-observation amplitude/phase distance computation.
Without argvals, the distance keys are None but mean-curve stats are always computed.
| Key | Meaning |
|---|---|
method |
Always "alignment" |
mean_length |
Number of evaluation points in the Karcher mean curve |
mean_min |
Minimum value of the mean curve |
mean_max |
Maximum value of the mean curve |
mean_avg |
Mean value of the mean curve |
mean_curve |
Full Karcher mean curve as a list |
n_obs |
Number of aligned observations; None when aligned_data absent |
amplitude_distances |
Per-observation amplitude distances from the mean; None when argvals absent |
phase_distances |
Per-observation phase distances from the mean; None when argvals absent |
amplitude_mean |
Mean amplitude distance; None when argvals absent |
amplitude_max |
Maximum amplitude distance; None when argvals absent |
phase_mean |
Mean phase distance; None when argvals absent |
phase_max |
Maximum phase distance; None when argvals absent |
converged |
Whether the Karcher iteration converged; None if not reported |
n_iter |
Number of Karcher iterations taken; None if not reported |
ls_score |
least_squares_score on the registered curves — mean \(L^2\) spread around the mean; lower is better; None when registration inputs absent |
pairwise_corr_score |
pairwise_correlation_score — mean centered functional Pearson correlation across all pairs; range \([-1,1]\); higher is better; None when absent |
sobolev_score |
sobolev_least_squares_score at a default \(\lambda\) — LS score plus derivative penalty; lower is better; None when absent or grid is non-uniform |
Registration-quality interpretation
pairwise_corr_score below 0.7 after shift registration suggests the phase variation is not purely rigid — prefer elastic alignment (karcher_mean). A high ls_score relative to the cross-sectional variance indicates persistent phase spread after alignment, recommending a wider max_shift or more Karcher iterations.
Task families: "interpretation" (assess phase/amplitude separation, registration quality) · "parameter" (adjust max iterations, tolerance, or max_shift)
· "method" (switch between elastic and non-elastic alignment; try banded alignment for large datasets)
basis
fdars source: fdars.basis.basis_nbasis_cv
Accepts a pre-computed cross-validation result dict (keys n_basis_values, gcv) or
raw data + argvals kwargs to trigger a live basis_nbasis_cv call.
| Key | Meaning |
|---|---|
method |
Always "basis" |
n_basis_values |
Basis count grid evaluated (list of ints) |
gcv_curve |
GCV score at each n_basis (list of floats) |
edf |
Effective degrees of freedom at each n_basis; None when absent |
gcv_aic_approx |
AIC approximation curve; None when edf or n_obs absent |
gcv_bic_approx |
BIC approximation curve; None when edf or n_obs absent |
optimal_n_basis |
n_basis minimising GCV |
optimal_gcv |
GCV at optimal n_basis |
optimal_edf |
EDF at optimal n_basis |
Task families: "interpretation" (assess basis complexity) · "parameter" (widen/narrow n_basis range)
· "method" (switch basis family)
fpca
fdars source: fdars.regression.fpca, fdars.pace_fpca
fpca returns a dict with scores, singular_values, rotation, mean. Eigenvalues
are derived as singular_values² / (n−1), matching FPCAResult.explained_variance.
pace_fpca returns pre-scaled eigenvalues directly — detected by the presence of the
"eigenvalues" key (unique to PACE; standard FPCA uses "singular_values").
Standard FPCA keys (from fdars.regression.fpca):
| Key | Meaning |
|---|---|
method |
Always "fpca" |
n_components |
Number of retained FPC components |
n_obs |
Number of observations (rows in scores) |
eigenvalues |
Per-component eigenvalues (list of floats); None when singular_values/scores absent |
explained_variance_ratio |
Per-component fraction of total variance |
cumulative_variance_explained |
Running cumulative explained variance |
total_variance |
Sum of all eigenvalues |
phase_leakage_indicator |
Fraction of variance NOT explained by the first component; high value (≥ 0.5) suggests phase variation leaking into the amplitude decomposition |
phase_leakage_flagged |
True when phase_leakage_indicator > 0.5 |
pace_fpca keys (trigger: "eigenvalues" in raw — unique to pace_fpca):
| Key | Meaning |
|---|---|
has_pace_fpca |
True when "eigenvalues" key is present in the raw dict |
pace_ncomp |
Actual number of PACE components returned (raw key "ncomp"); may be less than the requested count |
pace_sigma2 |
Measurement-noise variance estimate from PACE (raw key "sigma2") |
pace_variance_explained_cumulative |
Running cumulative variance explained by PACE eigenvalues |
pace_variance_explained_first |
Fraction of variance explained by the leading PACE component |
pace_noise_signal_ratio |
sigma2 / sum(eigenvalues): ratio of measurement-noise variance to total signal variance; None when total variance is zero (degenerate case) |
pace_truncated_rank_flagged |
True when the number of PACE components actually returned (pace_ncomp) is less than the number of raw eigenvalues — indicates the eigenvalue spectrum was truncated |
pace_mean_prediction_band_width |
Mean of fitted_upper - fitted_lower over the full (n, m) prediction grid; quantifies average pointwise uncertainty in the PACE fitted curves; None when confidence bands are absent |
PACE noise-to-signal interpretation
pace_noise_signal_ratio > 0.30 suggests that measurement noise is substantial relative
to the signal — consider increasing sigma2 or using fewer components. A
pace_truncated_rank_flagged=True result means the returned component count is smaller
than expected; increase ncomp if the scree suggests more components are meaningful.
Task families: "interpretation" (read scree / phase leakage; PACE: assess noise level and component count) · "parameter" (change n_comp; PACE: adjust bandwidth or sigma2)
· "method" (use elastic FPCA for dense regular data; use PACE for sparse irregular observations)
The fence below loads the Canadian Weather dataset, runs fpca, and builds the offline
diagnostics report. No API key is required — this runs live in the docs build.
from docs_data import load_canadian_weather
from fdars import regression
from fdars.advisor import build_diagnostics

day, X, meta = load_canadian_weather("temperature")
fp = regression.fpca(X, day, n_comp=4)
diag = build_diagnostics(fp, method="fpca")

print(f"n_components:                      {diag['n_components']}")
print(f"cumulative_variance_explained[0]:  {diag['cumulative_variance_explained'][0]:.4f}  FDARS_FENCE_OK")
print(f"phase_leakage_indicator:           {diag['phase_leakage_indicator']:.4f}")
print(f"phase_leakage_flagged:             {diag['phase_leakage_flagged']}")
fts
fdars source: fdars.fts.ftsm, fdars.fts.stationarity_test, fdars.fts.functional_acf,
fdars.fts.dpca, fdars.fts.fplsr
Six discriminated result shapes are handled via independent has_<fn> booleans. The
discriminator keys (tested in order, with fplsr tested before the bare forecast branch):
1. stationarity_test — unique key "n_perm" (with "statistic" and "p_value");
2. functional_acf / functional_pacf — unique key "upper_band";
3. dpca — unique keys "filter_lag" and "n_freqs";
4. fplsr — "fitted" + "forecast" + "ncomp" + forecast shape[0] == 1;
5. ftsm — unique key "ar_models";
6. ftsm_forecast / ftsm_forecast_multistep — "forecast" + "h".
stationarity keys (trigger: "n_perm" + "statistic" + "p_value" in raw):
| Key | Meaning |
|---|---|
has_stationarity |
True when result is from stationarity_test |
stationarity_statistic |
Test statistic (float); None when not stationarity result |
stationarity_p_value |
Permutation p-value in [0,1]; None when not stationarity result |
n_perm |
Number of permutations used (int); None when not stationarity result |
acf keys (trigger: "acf" + "upper_band" in raw):
| Key | Meaning |
|---|---|
has_acf |
True when result is from functional_acf or functional_pacf |
n_lags |
Number of lags computed (int); None when not acf result |
acf_at_lag1 |
First-lag autocorrelation (float); None when not acf result or empty |
acf_decay |
Last-lag value — proxy for ACF tail decay (float); None when not acf result |
dpca keys (trigger: "filter_lag" + "n_freqs" in raw):
| Key | Meaning |
|---|---|
has_dpca |
True when result is from dpca |
dpca_ncomp |
Number of dynamic PCA components (int); None when not dpca result |
n_freqs |
Frequency count (int); None when not dpca result |
filter_lag |
Lag window parameter (int); None when not dpca result |
dpca_eigenvalues |
Per-component peak spectral eigenvalue — float(np.max(ev)) for each component's frequency-domain spectrum (list of floats); None when not dpca result |
fplsr keys (trigger: "fitted" + "forecast" + "ncomp" + forecast.shape[0] == 1):
| Key | Meaning |
|---|---|
has_fplsr |
True when result is from fplsr |
fplsr_ncomp |
Number of PLS components (int); None when not fplsr result |
fplsr_fitted_rmse |
RMSE of fitted values over training observations (float); None when not fplsr result |
ftsm keys (trigger: "ar_models" in raw):
| Key | Meaning |
|---|---|
has_ftsm |
True when result is from ftsm |
ncomp |
Number of FTS components fitted (int); None when not ftsm result |
n_obs |
Number of training observations — inferred from scores shape[0] (int); None when not ftsm result |
n_points |
Evaluation grid size — inferred from mean shape[0] (int); None when not ftsm result |
n_ar_models |
Number of AR models fitted (equals ncomp) (int); None when not ftsm result |
ar_max_order |
Maximum AR lag order across all component models (int); None when not ftsm result or no models |
ar_sigma2_max |
Largest residual variance across all AR models (float); None when not ftsm result |
fitted_rmse |
Overall reconstruction RMSE across all fitted observations (float); None when not ftsm result |
ftsm_forecast keys (trigger: "forecast" + "h" in raw; only reached when fplsr discriminator is False):
| Key | Meaning |
|---|---|
has_forecast |
True when result is from ftsm_forecast or ftsm_forecast_multistep |
h |
Forecast horizon — number of steps ahead (int); None when not forecast result |
forecast_mean |
Mean value across all forecast points (float); None when not forecast result |
Task families: "interpretation" (read stationarity, ACF decay, ftsm component structure, forecast quality)
· "parameter" (adjust ncomp, n_perm, filter_lag, AR order)
· "method" (switch from ftsm to fplsr for covariate-driven forecasting; use dpca for frequency-domain decomposition)
import numpy as np
from fdars.fts import ftsm, ftsm_forecast, stationarity_test
from fdars.advisor import build_diagnostics

rng = np.random.default_rng(42)
n, m = 20, 30       # non-square: n != m (transposition guard)
t = np.linspace(0, 1, m)
data = np.array([np.sin(2 * np.pi * t + rng.uniform(0, 0.5)) +
                 0.1 * rng.standard_normal(m) for _ in range(n)])

fit = ftsm(data, t, ncomp=3)
diag_ftsm = build_diagnostics(fit, method="fts")

st = stationarity_test(data, t, n_perm=19, seed=42)
diag_stat = build_diagnostics(st, method="fts")

print(f"ftsm ncomp:           {diag_ftsm['ncomp']}")
print(f"ftsm n_ar_models:     {diag_ftsm['n_ar_models']}")
print(f"stationarity p_value: {diag_stat['stationarity_p_value']:.3f}  FDARS_FENCE_OK")
ftsm ncomp: 3 ftsm n_ar_models: 3 stationarity p_value: 0.850 FDARS_FENCE_OK
frechet
fdars source: fdars.frechet.frechet_mean, fdars.frechet.frechet_anova,
fdars.frechet.frechet_global_reg, fdars.frechet.frechet_local_reg
Diagnostics-only — frechet is NOT in _RUNNABLE_METHODS and cannot be invoked
via the MCP auto-run path. The caller runs the fdars function and passes the result
directly to build_diagnostics. Four result shapes are handled: frechet_mean returns
a naked numpy array (not a dict); the other three return dicts detected by key-presence guards.
The isinstance(raw, dict) check is applied first — before any dict key access —
so the array path is handled cleanly.
frechet_mean path (trigger: raw is a numpy array — not a dict):
| Key | Meaning |
|---|---|
has_frechet_mean |
True when raw is a numpy array (not a dict) |
frechet_mean_ndim |
Number of array dimensions: 1 for spherical/Euclidean, 2 for SPD/correlation (int); None when not frechet_mean result |
frechet_mean_dim |
Last dimension size d (int); None when not frechet_mean result |
frechet_mean_trace |
Matrix trace when ndim==2; None for 1-D arrays or non-frechet_mean paths |
frechet_anova keys (trigger: "p_value_permutation" + "group_labels" in raw):
| Key | Meaning |
|---|---|
has_anova |
True when result is from frechet_anova |
anova_p_value_permutation |
Permutation p-value in [0,1] (float); None when not anova result |
anova_p_value_asymptotic |
Asymptotic p-value in [0,1] (float); None when not anova result or absent |
n_perm |
Number of permutations used (int); None when not anova result |
n_groups |
Number of distinct groups derived from group_labels (int); None when not anova result |
pooled_frechet_variance |
Pooled within-group Fréchet variance (float); None when not anova result |
group_frechet_variance_max |
Maximum per-group Fréchet variance (float); None when not anova result |
frechet_global_reg and frechet_local_reg keys (trigger: "predicted" + "x_bar" in raw for global; "bandwidth" in raw for local):
| Key | Meaning |
|---|---|
has_global_reg |
True when result is from frechet_global_reg |
has_local_reg |
True when result is from frechet_local_reg |
predicted_n_obs |
Number of prediction-output objects — shape[0] of the predicted array (int); None when not a regression result |
bandwidth |
Kernel bandwidth (float); present for frechet_local_reg only; None for global regression |
Task families: "interpretation" (read mean geometry, group variance, regression prediction count)
· "parameter" (adjust n_perm for anova; adjust bandwidth for local regression)
· "method" (switch between global and local Fréchet regression; use anova to test group-mean differences)
represent
fdars source: raw Fdata object or {"data": …, "argvals": …} dict (pre-analysis check)
represent is a data-quality check that operates on the input data, not on an fdars
method output. Pass either an Fdata object or a plain dict with "data" and "argvals" keys.
| Key | Meaning |
|---|---|
method |
Always "represent" |
n_obs |
Number of functional observations (rows) |
n_points |
Number of evaluation grid points (columns) |
argvals_min |
Minimum grid value |
argvals_max |
Maximum grid value |
argvals_spacing_mean |
Mean spacing between adjacent argvals; None when fewer than 2 grid points |
argvals_spacing_std |
Std of argval spacing; None when fewer than 2 grid points |
is_uniform_grid |
True when spacing_std / spacing_mean < 0.01 (or trivially uniform) |
data_range_min |
Minimum value in the data matrix |
data_range_max |
Maximum value in the data matrix |
data_range_mean |
Mean value in the data matrix |
nan_frac |
Fraction of all data-matrix entries that are NaN; None when no NaN inputs were present |
has_boundary_nans |
True when any NaN appears in the first or last column of the data matrix (boundary NaN requires boundary-extension imputation rather than interpolation); None when no NaN inputs present |
imputation_method |
The ImputationMethod string used ("linear", "mean", or "constant"); None when imputation was not applied |
These three keys default None when the input data contains no NaN values — they populate only after an impute_missing_values call is included in the result.
Imputation-quality guidance
nan_frac above 0.30 suggests high missingness — the "mean" or "constant" imputation methods are safer than "linear" when more than a third of values per curve are missing. has_boundary_nans=True means linear imputation will extrapolate from the nearest valid interior point; consider "mean" imputation instead if the boundary values matter for downstream analysis.
Task families: "interpretation" (assess data quality / grid regularity / missingness) · "parameter" (adjust grid density or range; choose imputation method)
· "method" (switch to irregular-grid methods if is_uniform_grid=False; use impute_missing_values before smoothing or depth when NaN present)
depth
fdars source: any fdars.depth.* function — fraiman_muniz_1d, modal_1d,
random_projection_1d, etc. All depth functions return a raw ndarray (n,) score
array, not a dict. Pass the array directly to build_diagnostics.
The method_name keyword is required: it names the depth variant used.
| Key | Meaning |
|---|---|
method |
Always "depth" |
method_name |
Caller-supplied depth method name (e.g. "fraiman_muniz", "modal") |
n_obs |
Number of observations |
depth_min |
Minimum depth score (most peripheral curve) |
depth_max |
Maximum depth score (most central curve) |
depth_mean |
Mean depth score |
depth_median |
Median depth score |
depth_q10 |
10th-percentile depth score (flags peripheral curves) |
depth_q90 |
90th-percentile depth score |
depth_histogram |
10-bucket histogram of depth scores (list of 10 ints) |
Task families: "interpretation" (read depth distribution) · "parameter" (adjust depth method parameters)
· "method" (switch depth variant)
The fence below loads the Canadian Weather dataset, computes Fraiman–Muniz depth scores, and builds the offline diagnostics report. No API key is required — this runs live in the docs build.
from docs_data import load_canadian_weather
from fdars import depth
from fdars.advisor import build_diagnostics

day, X, meta = load_canadian_weather("temperature")
scores = depth.fraiman_muniz_1d(X, X)
diag = build_diagnostics(scores, method="depth", method_name="fraiman_muniz")

print(f"n_obs:       {diag['n_obs']}")
print(f"depth_mean:  {diag['depth_mean']:.4f}  FDARS_FENCE_OK")
print(f"depth_q10:   {diag['depth_q10']:.4f}")
print(f"depth_q90:   {diag['depth_q90']:.4f}")
outliers
fdars source: fdars.outliers.detect_outliers_lrt,
fdars.outliers.detect_outliers_lrt_with_dist,
fdars.outliers.outliergram,
fdars.outliers.magnitude_shape,
fdars.outliers.tvdmss,
fdars.outliers.muod,
fdars.outliers.sequential_transform_outliers,
fdars.outliers.depthgram
Eight result shapes are handled by key-presence guards (each detector's result is detected
by a unique combination of keys). magnitude_shape returns no "outliers" key —
n_outliers and outlier_fraction are None for that variant.
sequential_transform_outliers does not expose a score array so n_obs is None.
Base keys (all shapes):
| Key | Meaning |
|---|---|
method |
Always "outliers" |
n_obs |
Number of observations (inferred from the first score array present); None for sequential_transform_outliers |
n_outliers |
Count of flagged outliers; None for magnitude_shape results |
outlier_fraction |
Fraction flagged; None when "outliers" key absent |
threshold |
LRT threshold when present; None otherwise |
has_magnitude_shape |
True when "magnitude" and "shape" keys both present |
magnitude_range |
[min, max] of magnitude scores; None when absent |
shape_range |
[min, max] of shape scores; None when absent |
has_outliergram |
True when "mei" and "mbd" keys both present (and result is NOT depthgram) |
mei_range |
[min, max] of MEI scores; None when absent |
mbd_range |
[min, max] of MBD scores; None when absent |
tvdmss keys (trigger: "tvd" and "mss" both in raw):
| Key | Meaning |
|---|---|
has_tvdmss |
True when "tvd" and "mss" keys are present |
n_magnitude_outliers |
Count of tvdmss magnitude-direction outliers |
n_shape_outliers |
Count of tvdmss shape-direction outliers |
magnitude_outlier_fraction |
tvdmss magnitude-direction fraction; None when n_obs == 0 |
shape_outlier_fraction |
tvdmss shape-direction fraction; None when n_obs == 0 |
tvd_range |
[min, max] of TVD scores |
mss_range |
[min, max] of MSS scores |
muod keys (trigger: "amplitude_outliers" in raw):
| Key | Meaning |
|---|---|
has_muod |
True when "amplitude_outliers" key is present |
n_muod_magnitude_outliers |
muod magnitude-direction count |
n_muod_shape_outliers |
muod shape-direction count |
n_amplitude_outliers |
muod amplitude-direction count |
muod_magnitude_outlier_fraction |
muod magnitude fraction; None when n_obs == 0 |
muod_shape_outlier_fraction |
muod shape fraction; None when n_obs == 0 |
amplitude_outlier_fraction |
muod amplitude fraction; None when n_obs == 0 |
shape_index_range |
[min, max] of muod shape scores |
magnitude_index_range |
[min, max] of muod magnitude scores |
amplitude_index_range |
[min, max] of muod amplitude scores |
sequential_transform_outliers keys (trigger: "union_outliers" in raw):
| Key | Meaning |
|---|---|
has_sequential_transform |
True when "union_outliers" key is present |
n_union_outliers |
Size of the union of outliers across all sequential transform stages |
n_transforms |
Number of sequential detector stages (length of per_transform_outliers) |
depthgram keys (trigger: "mbd_mei_d" in raw):
| Key | Meaning |
|---|---|
has_depthgram |
True when "mbd_mei_d" key is present |
n_depthgram_shape_outliers |
depthgram shape-direction count |
n_depthgram_magnitude_outliers |
depthgram magnitude-direction count |
depthgram_shape_outlier_fraction |
depthgram shape fraction; None when n_obs == 0 |
depthgram_magnitude_outlier_fraction |
depthgram magnitude fraction; None when n_obs == 0 |
depthgram_mbd_range |
[min, max] of depthgram MBD scores |
depthgram_mei_range |
[min, max] of depthgram MEI scores |
Task families: "interpretation" (read outlier count and type) · "parameter" (adjust threshold or alpha)
· "method" (combine detectors; use tvdmss/muod/depthgram for direction-aware outlier analysis)
classification
fdars source: fdars.classification.fclassif_lda, fclassif_qda, fclassif_knn,
fclassif_kernel, fclassif_dd, fclassif_cv,
fdars.classification.elastic_multinomial
Three result shapes are handled by key-presence guards: point-estimate functions return
"accuracy"; fclassif_cv returns "error_rate" (emitted as cv_error_rate) and has
no "accuracy" key; elastic_multinomial returns "train_accuracy" (detected by the
unique train_accuracy key) and overrides n_classes from the raw dict.
n_classes cannot be inferred from the result dict for LDA/QDA/KNN variants —
supply it explicitly:
| Key | Meaning |
|---|---|
method |
Always "classification" |
n_obs |
Number of observations (from predicted length); None for CV-only results |
n_classes |
Caller-supplied ground-truth class count (overridden by elastic_multinomial's raw n_classes); None when not passed |
accuracy |
Proportion correctly classified; derived as 1 - cv_error_rate when only CV result present |
error_rate |
1 - accuracy for point-estimate results; None for CV-only |
cv_error_rate |
CV error rate from fclassif_cv (raw key "error_rate"); None for point-estimate |
fold_error_std |
Std of per-fold errors (CV path); None for point-estimate |
best_ncomp |
Number of FPC components minimising CV error; None for point-estimate |
elastic_multinomial keys (trigger: "train_accuracy" in raw AND "n_shapelets" NOT in raw — the shapelet classifier also exposes train_accuracy, so the absence of "n_shapelets" is required to correctly distinguish elastic_multinomial from the shapelet classifier):
| Key | Meaning |
|---|---|
has_elastic_multinomial |
True when "train_accuracy" key is present |
train_accuracy |
Training-set proportion correctly classified (float) |
train_error_rate |
1 - train_accuracy |
overfitting_gap |
train_accuracy - holdout_accuracy: difference between training accuracy and caller-supplied holdout or cross-validation accuracy. None unless holdout_accuracy is passed to build_diagnostics — the elastic_multinomial result has no holdout accuracy of its own and this gap is never fabricated (grounding invariant). A positive gap indicates overfitting |
n_classes_flagged |
True when n_classes > 2 (multiclass problem — elastic multinomial scales to K classes via a one-vs-rest structure; flag helps the LLM contextualise train_accuracy correctly); None when n_classes is not supplied |
overfitting_gap requires holdout_accuracy
overfitting_gap is None unless you pass holdout_accuracy=<float> to
build_diagnostics. The elastic_multinomial result dict contains only training
accuracy — the gap cannot be computed without an externally supplied holdout or
cross-validation accuracy. Do not pass holdout_accuracy from the same training
run used to fit the model; use a held-out test split or a CV error rate.
shapelet_classifier keys (trigger: "n_shapelets" in raw — unique to shapelet_classifier_fit; the coercion guard in __init__.py converts the PyShapeletClassifierFit opaque handle to a dict before this discriminator runs):
| Key | Meaning |
|---|---|
has_shapelet_classifier |
True when result is from shapelet_classifier_fit |
shapelet_n_shapelets |
Number of shapelets discovered and used (int); None when not shapelet classifier result |
shapelet_train_accuracy |
Training-set proportion correctly classified — clf.train_accuracy (float in [0,1]); None when not shapelet classifier result |
shapelet_n_classes |
Number of distinct label classes (int); None when not shapelet classifier result |
Opaque handle coercion
shapelet_classifier_fit returns a PyShapeletClassifierFit opaque PyO3 handle.
Pass it directly to build_diagnostics — the advisor's __init__.py coercion guard
(placed before the generic dict(raw) block) converts it to a plain dict via
{"n_shapelets": handle.n_shapelets, "train_accuracy": handle.train_accuracy, ...}
before the classification builder runs. No manual conversion is needed.
Task families: "interpretation" (read classification accuracy and CV stability; shapelet: assess discriminative subsequence count and training accuracy)
· "parameter" (tune k / n_comp; shapelet: adjust n_shapelets, quality, or classifier type)
· "method" (switch classifier; use elastic_multinomial for K-class problems in the elastic SRSF domain; use shapelet_classifier_fit when discriminative subsequence structure is expected)
regression
fdars source: fdars.regression.fregre_lm, fregre_pls, fregre_l1,
fregre_huber, fregre_np, fosr, fosr_fpc,
fdars.regression.functional_glm,
fdars.regression.concurrent_regression,
fdars.regression.fof_regression, fdars.regression.fof_re_regression,
fdars.scalar_on_function.fam, fdars.scalar_on_function.fregre_gsam,
fdars.scalar_on_function.fregre_gkam
Note that fregre_l1 and fregre_huber do not return r_squared — that key is
None for robust regression variants. fosr/fosr_fpc return 2-D residuals (shape
n × m); residual summary statistics are computed only for 1-D residual arrays.
functional_glm and concurrent_regression are detected by unique key guards and
expose their own sub-tables below.
Base keys (all variants):
| Key | Meaning |
|---|---|
method |
Always "regression" |
n_obs |
Number of observations (inferred from fitted_values or fitted) |
r_squared |
Coefficient of determination; None for fregre_l1 / fregre_huber |
residual_mean |
Mean residual; None for fosr/fosr_fpc/concurrent_regression (2-D residuals) |
residual_std |
Std of residuals; None for fosr/fosr_fpc/concurrent_regression |
residual_max_abs |
Maximum absolute residual; None for fosr/fosr_fpc/concurrent_regression |
residual_skew |
Pure-NumPy skewness of residuals; None for fosr/fosr_fpc/concurrent_regression |
beta_t_range |
[min, max] of beta_t; None for fregre_np and fosr/fosr_fpc |
has_fosr |
True only when "fitted" key is present AND the array is 2-D (also True for concurrent_regression) |
functional_glm keys (trigger: "deviance" in raw):
| Key | Meaning |
|---|---|
has_functional_glm |
True when "deviance" key is present (unique to functional_glm) |
deviance |
Model deviance — residual measure for the exponential-family fit (lower is better) |
aic |
Akaike Information Criterion from the score-space GLM |
bic |
Bayesian Information Criterion from the score-space GLM |
log_likelihood |
Log-likelihood at IRLS convergence |
iterations |
Number of IRLS iterations to convergence (key "iterations", NOT "n_iter") |
glm_ncomp |
Number of FPC components used in the GLM (raw key "ncomp") |
family |
Exponential-family name string ("gaussian", "binomial", "poisson", "gamma") |
Gamma AIC is not comparable to R glm() AIC
The aic value from functional_glm is computed in the FPC score space, not the
original data space. It is not comparable to AIC from R's glm() function, which
operates in the original response space.
concurrent_regression keys (trigger: "beta_curve" in raw):
| Key | Meaning |
|---|---|
has_concurrent_regression |
True when "beta_curve" key is present (unique to concurrent_regression) |
n_predictors |
Number of functional predictor curves (rows of beta_curve; shape (p, m)) |
concurrent_residual_rms |
Root-mean-squared residual over the full n × m grid; None when residuals absent |
concurrent_residual_max_abs |
Maximum absolute residual over the full grid; None when residuals absent |
fof_regression keys (trigger: "beta_surface" in raw — unique to fof_regression and fof_re_regression):
| Key | Meaning |
|---|---|
has_fof_regression |
True when "beta_surface" key is present AND the fitted array is 2-D (also True for fof_re_regression) |
fof_r_squared |
Scalar coefficient of determination from fof_regression result (float); None when key absent |
beta_surface_shape |
Shape of the beta surface as [ncomp_x, ncomp_y] (list of 2 ints); None when not FoF result |
beta_surface_max_abs |
Maximum absolute value in the beta surface (float); None when not FoF result |
fof_ncomp |
[ncomp_x, ncomp_y] — number of FPCA components for predictor and response (list of 2 ints); None when keys absent |
fof_re_regression keys (trigger: "random_effects" + "n_subjects" in raw — unique to fof_re_regression; has_fof_regression is also True for this result shape):
| Key | Meaning |
|---|---|
has_fof_re_regression |
True when "random_effects" and "n_subjects" keys are both present |
n_subjects |
Number of subjects in the random-effects model (int); None when not FoF-RE result |
sigma2_u_max |
Maximum subject-level random-effects variance — max(sigma2_u) (float); None when absent |
sigma2_eps |
Residual noise variance (float); None when absent |
re_dims |
Shape of the random-effects matrix as [n_subjects, m_y] (list of 2 ints); None when absent |
fam / fregre_gsam keys (trigger: "component_fits" + "fitted_values" in raw — shared by fam and fregre_gsam; has_fregre_gkam is the more specific discriminator for gkam which also has these keys):
| Key | Meaning |
|---|---|
has_fam |
True when "component_fits" and "fitted_values" keys are both present |
fam_n_obs |
Number of observations from fitted_values shape[0] (int); None when not FAM/GSAM result |
fam_n_components |
Number of smooth component fits (int); None when not FAM/GSAM result |
fam_r_squared |
Coefficient of determination (float); None when absent |
fam_ncomp |
Number of FPCA components (int); None when absent |
fregre_gkam keys (trigger: "converged" + "bandwidths" in raw — unique to fregre_gkam; has_fam is also True for gkam):
| Key | Meaning |
|---|---|
has_fregre_gkam |
True when "converged" and "bandwidths" keys are both present |
gkam_converged |
Whether the GKAM algorithm converged (bool); None when not GKAM result |
gkam_bandwidths |
Per-component kernel bandwidths (list of floats); None when not GKAM result |
gkam_n_predictors |
Number of functional predictors (int, inferred from bandwidths length); None when not GKAM result |
Task families: "interpretation" (read model fit and residual behaviour; FoF: assess beta-surface shape and R²; GKAM: assess convergence and component bandwidths)
· "parameter" (adjust regularisation or IRLS max_iter; FoF: adjust ncomp_x/ncomp_y via cross-validation)
· "method" (switch between scalar-response, function-on-scalar, GLM, and varying-coefficient regression; use fof_regression when both predictor and response are functional; use fam/fregre_gsam for additive smooth components)
regression_cv
fdars source: fdars.regression.fregre_cv, fdars.regression.model_selection_ncomp
Two source functions are detected by key presence: fregre_cv exposes "optimal_k";
model_selection_ncomp exposes "best_ncomp" and "criteria".
| Key | Meaning |
|---|---|
method |
Always "regression_cv" |
optimal_k |
Chosen number of components or nearest neighbours |
min_cv_error |
Minimum CV error; None for model_selection_ncomp |
cv_curve |
CV error (or GCV) values per k (list of floats) |
k_values |
Component counts matching cv_curve (list of ints) |
cv_curve_range |
[min, max] of cv_curve; None when curve is empty |
elbow_present |
True when the CV curve has a strict local minimum at an interior index (not at boundary) |
Task families: "interpretation" (read optimal k and curve shape) · "parameter" (widen k range to expose elbow)
· "method" (switch CV strategy or regression variant)
scoring
fdars source: fdars.scoring.functional_mae, fdars.scoring.functional_mse,
fdars.scoring.functional_mape, fdars.scoring.functional_msle,
fdars.scoring.functional_explained_variance
The scoring aspect reports domain-integrated prediction-quality scalars. Unlike
column-wise averages, each metric integrates the error (or squared error) over the
evaluation domain via Simpson's rule. Pass a dict with the computed scalar values directly
to build_diagnostics — the advisor does not recompute them.
from fdars.advisor import build_diagnostics
from fdars import scoring

# Assuming y_true, y_pred, argvals are arrays
result = {
    "functional_mae": scoring.functional_mae(y_true, y_pred, argvals),
    "functional_mse": scoring.functional_mse(y_true, y_pred, argvals),
    "functional_explained_variance": scoring.functional_explained_variance(y_true, y_pred, argvals),
}
diag = build_diagnostics(result, method="scoring")
| Key | Meaning |
|---|---|
method |
Always "scoring" |
functional_mae |
Mean absolute integrated error; same units as the data; robust to outlier curves |
functional_mse |
Mean squared integrated error; penalises large errors more heavily; squared units |
functional_mape |
Mean absolute percentage integrated error; None when not computed or inputs near zero |
functional_msle |
Mean squared log-error; None when not computed; requires all values \(> -1\) |
functional_explained_variance |
Integrated explained variance; range \((-\infty, 1]\); 1 = perfect prediction |
MAPE and MSLE domain restrictions
functional_mape raises ValueError when any |y_true(t)| < ε for any grid point — the library correctly rejects inputs near zero rather than producing numerically undefined results. functional_msle raises ValueError when any value is \(\leq -1\). Do not include these keys in the result dict when the data does not satisfy their domain conditions; use functional_mae or functional_mse instead.
The fence below builds a scoring diagnostics report on a synthetic regression prediction. No API key is required — this runs live in the docs build.
import numpy as np
from fdars.advisor import build_diagnostics
from fdars import scoring

rng = np.random.default_rng(42)
n, m = 12, 80
t = np.linspace(0, 1, m)
y_true = np.array([np.sin(2 * np.pi * t + rng.uniform(-0.2, 0.2)) for _ in range(n)])
y_pred = y_true + rng.normal(0, 0.08, size=y_true.shape)

result = {
    "functional_mae": scoring.functional_mae(y_true, y_pred, t),
    "functional_mse": scoring.functional_mse(y_true, y_pred, t),
    "functional_explained_variance": scoring.functional_explained_variance(y_true, y_pred, t),
}
diag = build_diagnostics(result, method="scoring")

print(f"functional_mae:                {diag['functional_mae']:.4f}")
print(f"functional_mse:                {diag['functional_mse']:.4f}")
print(f"functional_explained_variance: {diag['functional_explained_variance']:.4f}  FDARS_FENCE_OK")
Task families: "interpretation" (read prediction quality and choose a primary metric for reporting)
· "parameter" (adjust regularisation or model complexity to improve scores)
· "method" (switch from scalar to functional regression; use functional_explained_variance as primary quality signal; if MAPE or MSLE are undefined, fall back to MAE/MSE)
spm
fdars source: fdars.spm.spm_phase1, fdars.spm.mfpca, fdars.spm.spe_multivariate
Three distinct input shapes are handled. The spe_multivariate naked-array path is
checked first (before any dict-key access). When has_mfpca=True, the spm_phase1
sentinel fields (ncomp, eigenvalues, variance_explained_cumulative) are set to None
— the mfpca-specific keys carry that information instead.
SPM is the only aspect whose builder makes a live fdars call:
fdars.spm.spe_moment_match_diagnostic(spe_values) — a deterministic pure-moment
computation with no RNG, fully offline. The call is wrapped in try/except so
spe_kurtosis_excess and spe_moment_match_adequate degrade to None gracefully
when the compiled extension is unavailable.
spm_phase1 keys (from fdars.spm.spm_phase1):
| Key | Meaning |
|---|---|
method |
Always "spm" |
n_obs |
Number of observations (from T² array length) |
ncomp |
Number of PCA components retained; None when has_mfpca=True (mfpca input gating) |
t2_limit |
Hotelling T² control limit |
spe_limit |
SPE (Q) control limit |
t2_max |
Maximum T² value across all observations |
t2_mean |
Mean T² value |
t2_exceedance_rate |
Fraction of observations exceeding t2_limit |
spe_max |
Maximum SPE value |
spe_mean |
Mean SPE value |
spe_exceedance_rate |
Fraction of observations exceeding spe_limit |
eigenvalues |
PCA eigenvalues (list of floats, length = ncomp); None when has_mfpca=True |
variance_explained_cumulative |
Running cumulative variance explained; None when has_mfpca=True |
spe_kurtosis_excess |
Excess kurtosis of the SPE distribution (from spe_moment_match_diagnostic); None when fdars unavailable |
spe_moment_match_adequate |
True when the SPE distribution is adequately moment-matched; None when fdars unavailable |
mfpca keys (trigger: "eigenfunctions" + "scales" in raw — unique to mfpca vs spm_phase1; when has_mfpca=True the spm_phase1 ncomp and eigenvalues keys are None):
| Key | Meaning |
|---|---|
has_mfpca |
True when "eigenfunctions" and "scales" keys are both present |
mfpca_ncomp |
Number of MFPCA components — eigenvalues array length (int); None when not mfpca result |
mfpca_n_obs |
Number of observations from scores shape[0] (int); None when not mfpca result |
mfpca_n_variables |
Number of multivariate variables — len(eigenfunctions) (int); None when not mfpca result |
mfpca_eigenvalues |
MFPCA eigenvalues (list of floats); None when not mfpca result |
mfpca_variance_explained_cumulative |
Running cumulative variance explained by MFPCA eigenvalues (list of floats); None when not mfpca result |
spe_multivariate keys (trigger: raw is a naked numpy array — not a dict; spe_multivariate returns a 1-D array directly):
| Key | Meaning |
|---|---|
has_spe_multivariate |
True when raw is a numpy array (not a dict) |
spe_mv_n_obs |
Number of SPE values in the array (int); None when not spe_multivariate result |
spe_mv_max |
Maximum SPE value (float); None when not spe_multivariate result |
spe_mv_mean |
Mean SPE value (float); None when not spe_multivariate result |
spe_mv_all_nonneg |
True when all SPE values are ≥ 0 (bool); None when not spe_multivariate result |
mfpca ncomp gating
When has_mfpca=True, the spm_phase1 fields ncomp, eigenvalues, and
variance_explained_cumulative are all None — the mfpca-specific variants
(mfpca_ncomp, mfpca_eigenvalues, mfpca_variance_explained_cumulative) carry
the equivalent information. This gating prevents ambiguity when both spm_phase1-style
eigenvalue keys and mfpca-style eigenfunctions keys are present.
Task families: "interpretation" (read process stability and exceedance rates; mfpca: assess multivariate component structure and variance explained; spe_multivariate: assess SPE distribution shape)
· "parameter" (adjust ncomp or significance level; mfpca: adjust n_components per variable)
· "method" (add UCL monitoring or switch to functional T² variants; use mfpca for multivariate functional process monitoring)
inference
fdars source: caller-supplied TestResult or ToleranceBand dict from fdars.inference — diagnostics-only
Unlike every other aspect, inference does not call an fdars function internally. The caller runs one of the Phase 31 inference functions (fdars.inference.t_perm_test, f_perm_test, two_sample_mean_test, mean_scb, scb_two_sample_test, oneway_anova_vstat, flm_f_test, flm_gof_test) and passes the returned dict directly to build_diagnostics. This preserves the grounding invariant: the advisor never re-computes inference statistics.
Two input shapes are handled:
TestResult (primary — from permutation or asymptotic tests): keys statistic, p_value, n_perm.
n_perm == 0 is a legitimate value indicating the asymptotic path (e.g. Hotelling T² in two_sample_mean_test), not a missing value.
ToleranceBand / SCB (secondary — from mean_scb): keys lower, upper, center, half_width. Detected by the presence of half_width + center without p_value. All significance fields are set to None for this shape.
| Key | Meaning |
|---|---|
method |
Always "inference" |
statistic |
The fdars-computed test statistic (float); None for ToleranceBand path |
p_value |
Permutation or asymptotic p-value; None for ToleranceBand path |
n_perm |
Permutations used; 0 = asymptotic path; None when key absent |
significant_at_0.01 |
p_value < 0.01; None when p_value absent |
significant_at_0.05 |
p_value < 0.05; None when p_value absent |
significant_at_0.10 |
p_value < 0.10; None when p_value absent |
strongest_significance_level |
Smallest alpha at which the result is significant (0.01, 0.05, or 0.10); None when not significant at any level |
is_permutation_test |
True when n_perm > 0; False when n_perm == 0 (asymptotic); None when n_perm absent |
band_present |
True for the ToleranceBand path; absent from the TestResult path |
half_width |
Mean SCB half-width (float); present only for the ToleranceBand path |
ITP (Interval-wise Testing Procedure) keys (trigger: "adjusted_pvalues" in raw):
ITP results from fdars.inference functions that return an adjusted_pvalues vector (e.g.
flm_f_test, flm_gof_test) expose two complementary scalar families: detection (is the
effect globally significant?) and localisation (where on the domain is it significant?).
Both families are always emitted together — citing only detection without localisation (or
vice versa) would give the LLM a misleadingly incomplete picture (PITFALLS #8).
Detection scalars (whether the effect is present):
| Key | Meaning |
|---|---|
itp_result_present |
True when an ITP adjusted_pvalues vector was detected |
itp_min_adjusted_pvalue |
Minimum adjusted p-value across all basis functions (scalar float); small value → at least one basis function's contribution is globally significant |
itp_detected_at_0.05 |
True when itp_min_adjusted_pvalue < 0.05; overall detection flag at the conventional 5 % level |
itp_n_basis |
Number of basis functions tested (length of adjusted_pvalues array) |
itp_n_perm |
Number of permutations used in the ITP test |
Localisation scalars (where the effect is located):
| Key | Meaning |
|---|---|
itp_n_significant_0.05 |
Count of basis functions with adjusted p-value < 0.05; measures the breadth of the significant region |
itp_fraction_significant_0.05 |
itp_n_significant_0.05 / itp_n_basis; proportion of the basis functions in the significant region |
itp_first_significant_basis |
Zero-based index of the first basis function with adjusted p-value < 0.05; None when no basis function is significant; localises the onset of significance |
Detection vs. localisation
itp_detected_at_0.05 answers whether an effect is present.
itp_n_significant_0.05, itp_fraction_significant_0.05, and itp_first_significant_basis
answer where on the evaluation domain the effect is localised.
Both families are needed for a complete ITP interpretation — a significant detection
with low itp_fraction_significant_0.05 points to a narrow localised effect; a high
fraction points to broad significance.
Task families: "interpretation" (read significance level and test path; ITP: detect and localise) · "parameter" (adjust n_perm or significance threshold)
· "method" (switch between permutation test and asymptotic test; consider SCB for continuous inference)
The fence below constructs a small synthetic TestResult dict (no API key, no real permutation compute) and builds the offline diagnostics report — mirroring the offline precedent of the fpca and depth fences above.
from fdars.advisor import build_diagnostics

# Synthetic TestResult from a (hypothetical) permutation test.
# No fdars.inference call — grounding invariant preserved offline.
test_result = {
    "statistic": 3.142,
    "p_value": 0.038,
    "n_perm": 99,
}

diag = build_diagnostics(test_result, method="inference")

print(f"method:                     {diag['method']}")
print(f"p_value:                    {diag['p_value']:.3f}")
print(f"significant_at_0.05:        {diag['significant_at_0.05']}")
print(f"strongest_significance_level: {diag['strongest_significance_level']}")
print(f"is_permutation_test:        {diag['is_permutation_test']}  FDARS_FENCE_OK")