Examples
End-to-end case studies on real, classic functional-data datasets. Each
page loads a vendored dataset, runs a genuine fdars analysis, and generates
its figures at build time — so the code you read is exactly the code that
produced the plots.
The datasets (Berkeley Growth, Canadian Weather, Tecator, Phoneme, Wine, Sonar)
live under docs/data/ with sources and licenses documented in the
data README; the penicillin batches are synthetic. All are
loaded through the small helper docs_data.
Alignment & shape
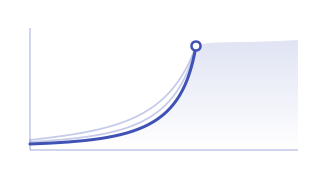
Growth curve alignment
Berkeley Growth: separate the timing of the pubertal growth spurt from its size with elastic alignment and the Karcher mean.
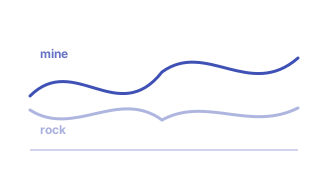
Sonar: mine vs rock
Does elastic/TSRVF alignment help classify sonar returns? An honest head-to-head against the raw curves.
Representation: Andrews curves
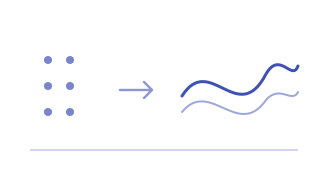
Andrews Wine: why curves?
Turn a 13-dimensional wine table into curves and watch three cultivars separate visually.
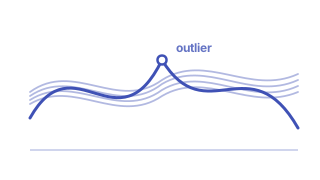
Andrews Wine: outliers
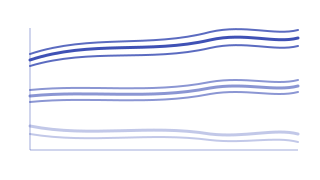
Functional depth and the outliergram flag atypical wines among the Andrews curves.
Andrews Wine: clustering
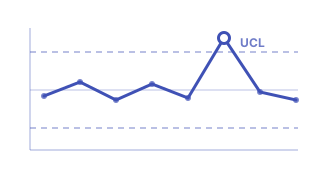
Cluster the curves, compare to the true cultivars, and see which chemical features drive the split.
Andrews Wine: quality control
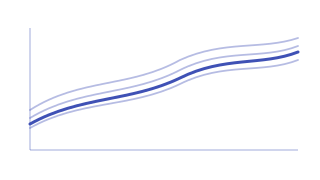
Treat one cultivar as in-control and flag out-of-spec wines with a functional tolerance view.
Regression & explainability
Predicting fat from NIR spectra
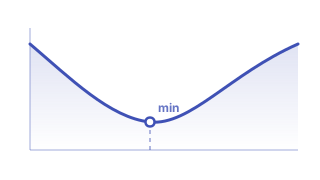
Tecator: scalar-on-function PLS predicts meat fat content, with an interpretable coefficient curve.
Honest model comparison
Out-of-fold cross-validation compares FPC-LM, PLS and NP regression — and exposes optimistic in-sample R².
Recovering predictive regions
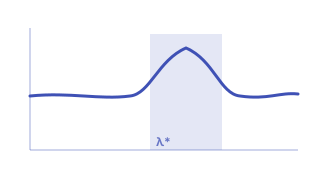
Which wavelengths drive the fat prediction? Significant-region and importance tools localize the signal.
Classification
Depth & outlier analysis
Seasonal & regional analysis
Weather curves: FPCA & clustering
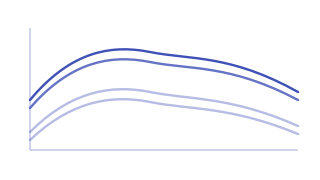
Canadian Weather: FPCA finds the dominant temperature modes and k-means recovers Canada's climate regions.
Annual cycle detection
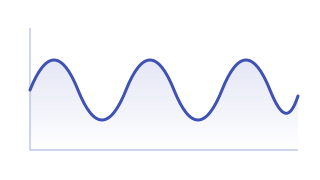
Recover the ~365-day period, quantify seasonal strength, and decompose a station with STL.
Geographic effects on rainfall
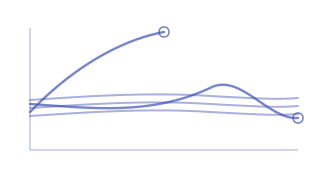
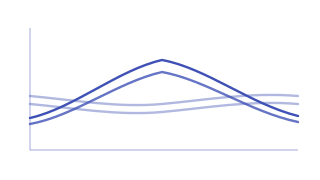
Precipitation profiles by region, with FPCA scores tracking latitude across the country.
Canadian depth & centrality
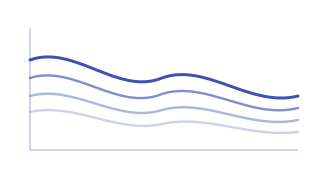
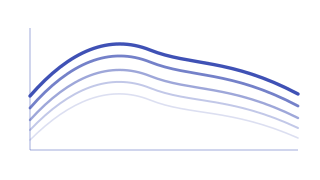
Rank 35 Canadian weather curves from most central to most atypical.
Process monitoring
Inline spectra monitoring
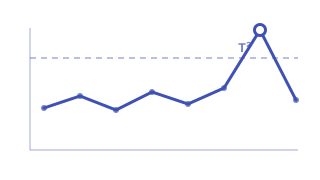
Tecator: a T²/SPE control chart flags off-spec spectra and contribution plots localize the fault.
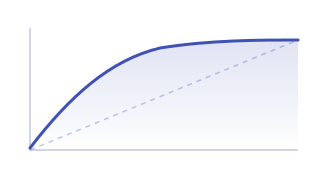
Detection power & false alarms
Trade off detection rate against false-alarm rate as the control limit is tightened.
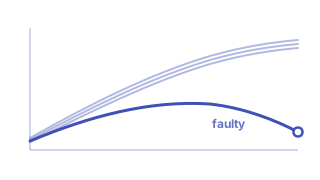
Penicillin batch monitoring
Monitor fermentation batches (synthetic) and catch faulty batches as their trajectories drift.
Tolerance & uncertainty
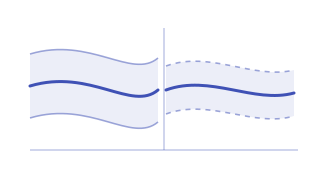
What each example shows
| Example | Dataset | fdars techniques |
|---|---|---|
| Growth curve alignment | Berkeley Growth | deriv_1d, elastic_align_pair, karcher_mean |
| Sonar: mine vs rock | Sonar | tsrvf_transform, elastic_self_distance_matrix, fclassif_knn |
| Andrews Wine: why curves? | Wine | Andrews transform, Fdata |
| Andrews Wine: outliers | Wine | depth, outliergram, magnitude_shape |
| Andrews Wine: clustering | Wine | kmeans_fd, gmm_cluster, silhouette_score_data |
| Andrews Wine: quality control | Wine | fpca_tolerance_band / spm |
| Predicting fat from NIR spectra | Tecator | fregre_pls, predict_fregre_pls, fregre_np |
| Honest model comparison | Tecator | fregre_cv, model_selection_ncomp |
| Recovering predictive regions | Tecator | significant_regions, pointwise_importance, functional_pdp |
| Phoneme recognition | Phoneme | fclassif_knn, fclassif_lda, fclassif_cv |
| Weather curves: FPCA & clustering | Canadian Weather | fpca, kmeans_fd, silhouette_score_data |
| Annual cycle detection | Canadian Weather | estimate_period_fft, seasonal_strength, stl_decompose |
| Geographic effects on rainfall | Canadian Weather | fpca, fosr |
| Inline spectra monitoring | Tecator | spm_phase1, spm_monitor, hotelling_t2 |
| Detection power & false alarms | Penicillin (synthetic) | spm_phase1, t2_control_limit, arl0_t2 |
| Penicillin batch monitoring | Penicillin (synthetic) | spm_phase1, spm_monitor, t2_pc_contributions |
| Canadian Weather: Fréchet Regression | Canadian Weather | frechet_global_reg, frechet_local_reg, wasserstein_barycenter |
| Canadian Weather: FTS Forecast | Canadian Weather | ftsm, ftsm_forecast_multistep, stationarity_test, functional_acf |
| Phoneme: Shapelet Classification | Phoneme | discover_shapelets, shapelet_transform_fit, shapelet_transform, shapelet_classifier_fit |
| Functional outlier workflow | Synthetic | depth, magnitude_shape, outliergram |
| Ranking curves by centrality | Canadian Weather | depth (fraiman_muniz, modified_band), deepest |
| Tolerance vs conformal bands | Canadian Weather | fpca_tolerance_band, conformal_prediction_band |