Density FDA
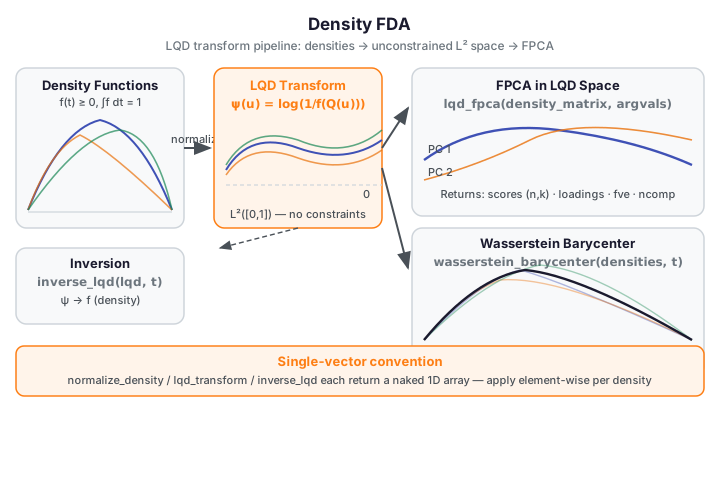
Density FDA treats probability density functions as functional observations and applies functional data analysis techniques to them. The key challenge is that densities live in a constrained Bayes space — they must be non-negative and integrate to one — which rules out standard Euclidean methods. The Log-Quantile-Density (LQD) transform maps each density to an unconstrained \(L^2([0,1])\) function, enabling Euclidean FPCA, regression, and barycenter computation in that transformed space.
| Method | fdars function |
Key output |
|---|---|---|
| Normalize to unit integral | normalize_density |
(m,) density |
| Log-quantile-density transform | lqd_transform |
(n_q,) LQD values on quantile grid |
| Reconstruct density from LQD | inverse_lqd |
(m,) density on target grid |
| Geometric mean of densities | wasserstein_barycenter |
(m,) barycenter density |
| Functional PCA of densities | lqd_fpca |
scores, loadings, fve (all on quantile grid) |
When to use
Use density FDA when your data objects are probability distributions rather than ordinary curves. Examples include age-at-death distributions across countries, income distributions across regions, spectral energy distributions of phoneme recordings, or any collection where each observation is a normalized histogram or kernel density estimate.
Why not apply standard FPCA directly to density curves? Raw densities satisfy the non-negativity and unit-integral constraints — pointwise averaging of two valid densities yields a valid density only by chance, and the \(L^2\) metric between densities is not Wasserstein-optimal. The LQD transform sidesteps both issues by mapping each density to an unconstrained \(L^2([0,1])\) function on which ordinary FPCA, regression, and averaging are geometrically correct.
Contrast with Fréchet regression: If your response variable is a density (and your
predictors are scalar or Euclidean), use fdars.frechet — see
Fréchet Regression. This page covers the case where
densities are your primary data objects and you want to summarize, decompose, or compare
them via LQD-space FPCA.
Start with normalize_density
Before any LQD operation, run each raw density curve through normalize_density.
This converts non-negative values (that need not integrate to 1) to a proper unit
density. lqd_transform requires strictly positive input; even a small additive
floor (+ 0.01) before normalization avoids division-by-zero at the boundary.
Core Concept
Let \(f\) be a probability density on a bounded interval \([a, b]\). Define its quantile function \(Q(u)\) as the inverse of its CDF \(F\). The Log-Quantile-Density (LQD) transform maps \(f\) to:
The transformation is invertible via \(f(x) = \exp(-\psi(F(x)))\), and it maps the non-negative constraint of the density space to the unconstrained \(L^2([0,1])\) space. Operations that are not geometrically meaningful in density space — such as pointwise averaging — become correct in LQD space. FPCA in LQD space identifies the principal modes of density shape variation, and the Wasserstein barycenter computes the geometric mean of a collection of densities.
LQD output lives on the quantile grid, not the original argvals grid
lqd_transform(density, argvals) returns an array of length n_q (default
max(m, 101)) on the uniform quantile grid \([0, 1]\) — this is not the
same length as your input argvals grid of length m. Comparing or combining
LQD output with the original grid leads to shape errors.
After calling lqd_transform, construct the quantile grid explicitly before
calling inverse_lqd:
Density Normalization
| Parameter | Type | Description |
|---|---|---|
density |
np.ndarray (m,) |
Non-negative density values (need not integrate to 1) |
argvals |
np.ndarray (m,) |
Evaluation grid |
Returns a 1D array (m,) normalized so that \(\int f\,dt \approx 1\). Raises ValueError
if any value is negative or if the integral is effectively zero.
LQD Transform and Inverse
LQD transform
from fdars.density_fda import lqd_transform

psi = lqd_transform(density, argvals, n_quantile_pts=None)
| Parameter | Type | Default | Description |
|---|---|---|---|
density |
np.ndarray (m,) |
— | Strictly positive, normalized density |
argvals |
np.ndarray (m,) |
— | Evaluation grid |
n_quantile_pts |
int \| None |
None |
Quantile grid resolution; None uses max(m, 101) |
Returns a 1D array of shape (n_q,) where n_q = n_quantile_pts or max(m, 101). The
output represents \(\psi(u)\) evaluated on the uniform quantile grid np.linspace(0, 1, n_q).
Inverse LQD transform
| Parameter | Type | Description |
|---|---|---|
psi |
np.ndarray (n_q,) |
LQD values on the quantile grid |
t_grid |
np.ndarray (n_q,) |
Uniform quantile grid corresponding to psi, i.e. np.linspace(0, 1, len(psi)) |
target_argvals |
np.ndarray (m,) |
Reconstruction grid — the original argvals |
Returns a 1D array (m,) — the reconstructed density on target_argvals.
inverse_lqd requires the explicit quantile grid as second argument
Unlike many inversion routines that take only the transformed values and the target
grid, inverse_lqd needs the quantile grid t_grid explicitly — because the
quantile grid has length n_q (potentially different from m). Always set
t_grid = np.linspace(0, 1, len(psi)) before calling inverse_lqd.
Round-trip fence
import numpy as np
from fdars.density_fda import normalize_density, lqd_transform, inverse_lqd

rng = np.random.default_rng(42)
m = 50
t = np.linspace(0, 1, m)
raw = np.abs(np.sin(np.pi * t + 0.2)) + 0.01

norm  = normalize_density(raw, t)    # (m,) — valid density
psi   = lqd_transform(norm, t)       # (n_q,) — on the quantile grid, NOT shape (m,)
n_q   = len(psi)
t_q   = np.linspace(0, 1, n_q)      # quantile grid for inverse_lqd
recon = inverse_lqd(psi, t_q, t)    # (m,) — back to original grid

print(f"norm integral:  {np.trapezoid(norm, t):.4f}  (should be ~1.0)")
print(f"psi shape:      {psi.shape}  (quantile grid, n_q={n_q} != m={m})")
print(f"recon integral: {np.trapezoid(recon, t):.4f}  (round-trip, should be ~1.0)")
print("FDARS_FENCE_OK")
norm integral: 1.0000 (should be ~1.0) psi shape: (101,) (quantile grid, n_q=101 != m=50) recon integral: 1.0000 (round-trip, should be ~1.0) FDARS_FENCE_OK
This fence demonstrates the load-bearing correctness proof: psi.shape shows that the
LQD output has n_q elements (here 101, since max(50, 101) = 101), confirming it is
not the same shape as the m=50 input grid. The round-trip integral close to 1.0
verifies the inversion is accurate.
Wasserstein Barycenter
The Wasserstein barycenter computes the geometric mean of a collection of densities in Wasserstein space — the result is the density that minimizes the sum of squared Wasserstein distances to all inputs. Unlike the pointwise average, the Wasserstein barycenter respects the constraint that the result is a valid density, and it interpolates the shape of the input densities rather than their pointwise values.
from fdars.density_fda import wasserstein_barycenter

bary = wasserstein_barycenter(density_matrix, argvals, weights=None)
| Parameter | Type | Default | Description |
|---|---|---|---|
density_matrix |
np.ndarray (n, m) |
— | Each row is a normalized density (non-negative, integrating to 1) |
argvals |
np.ndarray (m,) |
— | Evaluation grid |
weights |
np.ndarray (n,) \| None |
None |
Non-negative weights summing to 1; uniform if None |
Returns a 1D array (m,) — the Wasserstein barycenter density.
Input rows must be valid unit densities
wasserstein_barycenter requires each row of density_matrix to be non-negative
and integrate (approximately) to 1. Always apply normalize_density to each row
before stacking them into the matrix. Passing raw, unnormalized density values
leads to a barycenter that does not integrate to 1.
LQD-FPCA — Functional PCA of Densities
LQD-FPCA applies standard FPCA in the LQD-transformed space, identifying the principal modes of density shape variation. Because the LQD transform is an isometry between the Wasserstein space of densities and \(L^2([0,1])\), the LQD loadings have a direct geometric interpretation: each loading describes a direction of density-shape variation in Wasserstein geometry (e.g. a shift in the mode location, a change in spread).
from fdars.density_fda import lqd_fpca

fp = lqd_fpca(density_matrix, argvals, ncomp=3, n_quantile_pts=None)
| Parameter | Type | Default | Description |
|---|---|---|---|
density_matrix |
np.ndarray (n, m) |
— | Each row is a strictly positive, normalized density |
argvals |
np.ndarray (m,) |
— | Evaluation grid |
ncomp |
int |
3 |
Number of principal components |
n_quantile_pts |
int \| None |
None |
Quantile grid resolution; None uses max(m, 101) |
Returns — lqd_fpca
| Key | Shape | Description |
|---|---|---|
mean |
(n_q,) |
Mean LQD function on the quantile grid |
singular_values |
(ncomp,) |
Singular values |
loadings |
(n_q, ncomp) |
LQD principal component loadings on the quantile grid |
scores |
(n, ncomp) |
FPCA scores — use these as features for downstream analysis |
fve |
(ncomp,) |
Fraction of variance explained (cumulative) |
ncomp |
int |
Number of retained components |
mean and loadings are on the quantile grid (n_q,), not (m,)
The LQD-FPCA results — mean, loadings — are on the quantile grid of length n_q,
not the original argvals grid of length m. To visualize a loading against the
original domain, use inverse_lqd to map it back. Do not plot fp['loadings']
against the original argvals directly; use np.linspace(0, 1, n_q) as the x-axis
or back-transform via inverse_lqd.
Barycenter and LQD-FPCA fence
import numpy as np
from fdars.density_fda import normalize_density, lqd_transform, inverse_lqd
from fdars.density_fda import wasserstein_barycenter, lqd_fpca

rng = np.random.default_rng(42)
m, n = 50, 12
t = np.linspace(0.01, 0.99, m)

raw   = np.array([np.abs(np.sin(np.pi * t + rng.uniform(0, 0.5))) + 0.02
                  for _ in range(n)])
norms = np.array([normalize_density(raw[i], t) for i in range(n)])

# Wasserstein barycenter
bary = wasserstein_barycenter(norms, t)

# LQD round-trip on first density
psi_0 = lqd_transform(norms[0], t)          # (n_q,)
n_q   = len(psi_0)
t_q   = np.linspace(0, 1, n_q)
recon = inverse_lqd(psi_0, t_q, t)          # (m,) round-trip

# LQD-FPCA over all densities
fp = lqd_fpca(norms, t, ncomp=2)

print(f"norm integral (density 0): {np.trapezoid(norms[0], t):.4f}")
print(f"recon integral (round-trip): {np.trapezoid(recon, t):.4f}")
print(f"barycenter integral: {np.trapezoid(bary, t):.4f}")
print(f"lqd_fpca scores shape: {np.asarray(fp['scores']).shape}  (n, ncomp)")
print(f"fve (cumulative): {np.asarray(fp['fve']).round(3).tolist()}")
print("FDARS_FENCE_OK")
norm integral (density 0): 1.0000 recon integral (round-trip): 1.0000 barycenter integral: 1.0000 lqd_fpca scores shape: (12, 2) (n, ncomp) fve (cumulative): [0.798, 1.0] FDARS_FENCE_OK
Parameter Selection and Result Interpretation
Choosing ncomp via fve
The fve key in lqd_fpca gives the cumulative fraction of variance explained. Use
it to select ncomp:
fp  = lqd_fpca(density_matrix, argvals, ncomp=10)
fve = np.asarray(fp["fve"])                  # cumulative FVE per component
ncomp_choice = int(np.argmax(fve >= 0.90)) + 1
print(f"Components for 90% FVE: {ncomp_choice}")
A typical density population is well-explained by 2–4 components (the dominant modes are location, scale, and skewness shifts). If the first component explains > 80% of variance, the collection has little density-shape variation and a single component suffices.
Reading LQD loadings
Each column of fp['loadings'] (shape (n_q, ncomp)) is a function on the uniform
quantile grid \([0, 1]\). Positive values of a loading at quantile \(u\) mean that densities
with high scores on that component have more probability mass in the region around quantile
\(u\). A loading that shifts from negative to positive across the quantile range corresponds
to a location (mode) shift in the original density space.
Using scores downstream
The scores matrix (n, ncomp) is the natural feature representation for downstream
tasks — clustering, classification, regression with scalar predictors. Because the LQD
transform is an isometry, distances in score space approximate Wasserstein distances
between the original densities.
Density visualization fence
import numpy as np
from docs_fig import fig, render
from fdars.density_fda import normalize_density, wasserstein_barycenter, lqd_fpca

rng = np.random.default_rng(42)
m, n = 60, 10
t = np.linspace(0.01, 0.99, m)

# Simulate densities with varying mode locations
raw   = np.array([
    np.abs(np.sin(np.pi * t + rng.uniform(0.1, 1.0))) + 0.02
    for _ in range(n)
])
norms = np.array([normalize_density(raw[i], t) for i in range(n)])
bary  = wasserstein_barycenter(norms, t)
fp    = lqd_fpca(norms, t, ncomp=2)

f, axes = fig(1, 2, figsize=(11.0, 4.0))

# Left: individual densities + barycenter
ax = axes[0]
for i, d in enumerate(norms):
    ax.plot(t, d, color="#6c757d", lw=0.9, alpha=0.4, label="_")
ax.plot(t, bary, color="#e8710a", lw=2.4, label="Wasserstein barycenter")
ax.set(title="Density sample + Wasserstein barycenter",
       xlabel="t", ylabel="density")
ax.legend()

# Right: LQD-FPCA score scatter (2 components)
scores = np.asarray(fp["scores"])
fve    = np.asarray(fp["fve"])
ax2 = axes[1]
ax2.scatter(scores[:, 0], scores[:, 1], color="#3f51b5", s=60, edgecolors="white", lw=0.6)
ax2.set(title=f"LQD-FPCA score scatter\nFVE: {fve[0]:.0%} + {fve[1]-fve[0]:.0%}",
        xlabel="PC1 score", ylabel="PC2 score")
ax2.axhline(0, color="#6c757d", lw=0.7, ls="--")
ax2.axvline(0, color="#6c757d", lw=0.7, ls="--")

print(render(f))
print("FDARS_FENCE_OK")
Methods available in R but not yet in Python
- Fréchet regression on density responses — if the response variable is a density,
use
fdars.frechetwhich providesfrechet_global_regfor Wasserstein regression. See Fréchet Regression for the full API. - Density-on-scalar regression beyond Fréchet global — fitting a flexible nonlinear
regression of density responses on scalar predictors is not directly exposed in
fdarsbeyondfrechet_global_reg.
See also
- Fréchet Regression — regression when the response variable is a density (Wasserstein space)
- Functional Statistics — standard FPCA and covariance for non-density functional data
- Outlier Detection — detecting outlier densities using depth and distance
- Analyze index
References
- Petersen, A. and Müller, H.-G. (2016). Functional data analysis for density functions by transformation to a Hilbert space. Annals of Statistics 44(1), 183–218.
- van den Boogaart, K. G., Egozcue, J. J. and Pawlowsky-Glahn, V. (2014). Bayes Hilbert spaces. Australian & New Zealand Journal of Statistics 56(2), 171–194.