Fréchet Regression
Fréchet regression extends regression analysis to settings where the response lives in a non-Euclidean metric space — such as the manifold of symmetric positive-definite (SPD) matrices, the unit sphere, or a space of probability distributions. Instead of a Euclidean conditional mean, the model estimates a conditional Fréchet mean: the minimizer of a weighted sum of squared metric distances to the observed responses.
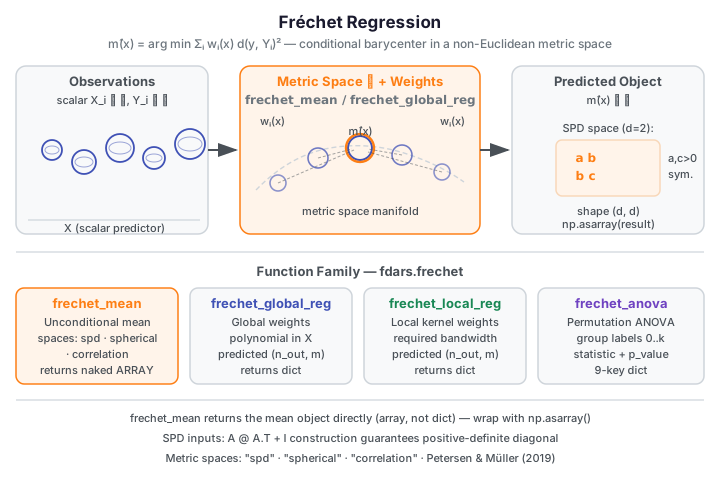
Core Concept
Let \(Y_1, \ldots, Y_n\) be response objects in a metric space \((\mathcal{M}, d)\) and let \(X_i \in \mathbb{R}^p\) be scalar predictors. The global Fréchet regression model estimates the conditional Fréchet mean:
where the weights \(w_i(x)\) depend on the distance between \(x\) and \(X_i\) (global model: polynomial weights; local model: kernel weights). The unconditional Fréchet mean is the special case \(w_i \equiv 1/n\).
When to use
Use Fréchet regression when your response cannot be averaged in the Euclidean sense — density curves, covariance matrices, correlation matrices, or directions on a sphere. For scalar or functional responses in ordinary Euclidean space, use Scalar-on-Function Regression instead.
| Method | fdars function |
Key idea |
|---|---|---|
| Unconditional Fréchet mean | frechet_mean |
Weighted Fréchet mean with no predictor |
| Global Fréchet regression | frechet_global_reg |
Polynomial-weighted conditional Fréchet mean, density responses |
| Local Fréchet regression | frechet_local_reg |
Kernel-weighted conditional Fréchet mean, density responses |
| Fréchet ANOVA | frechet_anova |
Test equality of Fréchet means across groups, density responses |
Quick rule: if your responses are density curves driven by a scalar predictor, start
with frechet_global_reg (simpler, no bandwidth to tune). Switch to frechet_local_reg
when the relationship is nonlinear and you can spare time to choose a bandwidth. Use
frechet_mean alone for an unconditional summary across SPD, spherical, or correlation
space. For Euclidean functional responses, Scalar-on-Function Regression
is faster and gives an interpretable coefficient function.
Density-response constraint
The regression functions frechet_global_reg, frechet_local_reg, and
frechet_anova operate exclusively on density-response data: the responses
matrix must be (n, m) where each row is a non-negative function evaluated on the
same strictly increasing argvals grid. The rows should integrate to approximately 1
(the binding does not enforce this, but the Petersen–Müller signed-weight quantile
averaging is designed for densities). frechet_mean handles the broader SPD /
spherical / correlation spaces separately.
1. Unconditional Fréchet Mean
frechet_mean computes the weighted Fréchet mean of a collection of objects in one of
three metric spaces: symmetric positive-definite matrices ("spd"), unit-sphere vectors
("spherical"), or correlation matrices ("correlation").
| Parameter | Type | Description |
|---|---|---|
objects |
list of np.ndarray |
List of metric-space objects (2D array for SPD/correlation, 1D for spherical) |
space |
str |
Metric space: "spd", "spherical", or "correlation" |
d |
int |
Ambient dimension |
weights |
np.ndarray (n,) or None |
Optional observation weights (uniform 1/n if None) |
Return type varies by space:
| Space | Return | Constraint |
|---|---|---|
"spd" |
np.ndarray (d, d) |
Symmetric with positive diagonal |
"spherical" |
np.ndarray (d,) |
Unit-norm vector |
"correlation" |
np.ndarray (d, d) |
Unit diagonal + symmetric |
In-binding validation raises ValueError for non-SPD inputs (non-symmetric or
non-positive diagonal), non-unit-norm spherical inputs, and non-unit-diagonal correlation
matrices.
import numpy as np
from fdars.frechet import frechet_mean

rng = np.random.default_rng(42)
d = 2
# Build a list of SPD (symmetric positive-definite) matrices via A @ A.T + I
spds = []
for _ in range(8):
    A = rng.standard_normal((d, d))
    spds.append(A @ A.T + np.eye(d))

mean_spd = np.asarray(frechet_mean(spds, space="spd", d=d))
print(f"Fréchet mean (SPD, d=2): shape {mean_spd.shape}")
print(f"positive diagonal: {mean_spd[0, 0] > 0} {mean_spd[1, 1] > 0}")
print("FDARS_FENCE_OK")
Fréchet mean (SPD, d=2): shape (2, 2) positive diagonal: True True FDARS_FENCE_OK
Return type: naked array, not a dict
frechet_mean returns the mean object directly — a (d, d) array for SPD space,
a (d,) array for spherical space, and a (d, d) array for correlation space.
It does not return a dict. Wrap the result in np.asarray(...) before indexing.
2. Global and Local Fréchet Regression
Both functions predict conditional Fréchet means at new predictor locations using a density-response matrix.
from fdars.frechet import frechet_global_reg, frechet_local_reg

result_global = frechet_global_reg(predictors, responses, argvals, xout)
result_local  = frechet_local_reg(predictors, responses, argvals, xout, bandwidth)
| Parameter | Type | Description |
|---|---|---|
predictors |
np.ndarray (n, p) |
Scalar predictor matrix — one column per predictor variable |
responses |
np.ndarray (n, m) |
Density-response matrix — each row a density curve on argvals |
argvals |
np.ndarray (m,) |
Strictly increasing evaluation grid |
xout |
np.ndarray (n_out, p) |
Predictor values at which to predict — must be 2D, even for p=1 |
bandwidth |
float |
Kernel bandwidth for local regression (required, must be positive) |
frechet_global_reg return keys:
| Key | Type | Description |
|---|---|---|
predicted |
np.ndarray (n_out, m) |
Predicted conditional Fréchet mean density at each xout row |
xout |
np.ndarray (n_out, p) |
Predictor output grid (echoed) |
x_bar |
np.ndarray (p,) |
Mean predictor used for centering |
frechet_local_reg return keys (differ from global — no x_bar, has bandwidth):
| Key | Type | Description |
|---|---|---|
predicted |
np.ndarray (n_out, m) |
Predicted conditional Fréchet mean density at each xout row |
xout |
np.ndarray (n_out, p) |
Predictor output grid (echoed) |
bandwidth |
float |
Bandwidth used (echoed) |
xout must be 2-D
Even for a single scalar predictor (p=1), xout must be a 2-D array of shape
(n_out, 1). Passing a 1-D array np.array([0.5, 1.0]) raises a shape error.
Always use xout = np.array([[0.5], [1.0]]) or xout.reshape(-1, 1).
import numpy as np
from fdars.frechet import frechet_global_reg, frechet_local_reg

rng = np.random.default_rng(7)
n, m = 20, 30
t = np.linspace(-3.0, 3.0, m)

# Build density responses: Gaussian bumps centred at scalar predictor x_i.
# Each row integrates to ≈1 after trapezoid normalisation.
x = rng.uniform(-1.5, 1.5, (n, 1))          # scalar predictor, shape (n, 1)
responses = np.zeros((n, m))
for i in range(n):
    mu = x[i, 0]
    bump = np.exp(-0.5 * ((t - mu) / 0.8) ** 2)
    denom = np.trapezoid(bump, t)
    responses[i] = bump / denom              # normalise to integrate to 1

predictors = x                               # shape (n, 1)
xout = np.array([[-1.0], [0.0], [1.0]])      # shape (n_out, 1) — MUST be 2-D

res_g = frechet_global_reg(predictors, responses, t, xout)
res_l = frechet_local_reg(predictors, responses, t, xout, bandwidth=1.5)

# Global keys: predicted, xout, x_bar
print("Global keys:", sorted(res_g.keys()))
print(f"  predicted shape: {np.asarray(res_g['predicted']).shape}")
print(f"  x_bar: {np.asarray(res_g['x_bar'])}")

# Local keys: predicted, xout, bandwidth  (no x_bar)
print("Local keys:", sorted(res_l.keys()))
print(f"  predicted shape: {np.asarray(res_l['predicted']).shape}")
print(f"  bandwidth: {res_l['bandwidth']}")
print("FDARS_FENCE_OK")
Global keys: ['predicted', 'x_bar', 'xout'] predicted shape: (3, 30) x_bar: [0.22907567] Local keys: ['bandwidth', 'predicted', 'xout'] predicted shape: (3, 30) bandwidth: 1.5 FDARS_FENCE_OK
2.1 Bandwidth selection for local regression
The bandwidth parameter controls how locally the kernel weights concentrate around each
xout predictor value. There is no built-in cross-validation for Fréchet local
regression; choose bandwidth manually by inspecting predicted-curve smoothness:
Bandwidth guidance
- Start with
bandwidth ≈ std(predictors)as a neutral first guess. - Too small (narrow bandwidth): predicted curves become erratic between nearby
xoutvalues — only a handful of training observations contribute appreciable weight at each prediction point. - Too large (wide bandwidth): predicted curves converge toward the unconditional Fréchet mean — the local structure is washed out.
- Inspect
res["predicted"]row-by-row: curves at adjacentxoutvalues should shift smoothly.
3. Interpreting Predicted Density Curves
The rows of result["predicted"] are the model's estimated conditional Fréchet means:
density functions evaluated at the same argvals grid used for training.
Because the Petersen–Müller signed-weight quantile averaging can produce negative
weights (in extrapolation regions), the predicted rows are not guaranteed to be strictly
non-negative. In practice, for xout within the range of the training predictors the
predicted curves remain close to valid densities; extrapolation may produce small negative
excursions.
For SPD matrix responses (via frechet_mean with space="spd"), the returned mean is
always symmetric and positive-definite by construction.
4. Figure: Predicted Density Curves at Three Predictor Values
import numpy as np
from docs_fig import fig, render
from fdars.frechet import frechet_global_reg

rng = np.random.default_rng(7)
n, m = 20, 40
t = np.linspace(-3.0, 3.0, m)

x = rng.uniform(-1.5, 1.5, (n, 1))
responses = np.zeros((n, m))
for i in range(n):
    mu = x[i, 0]
    bump = np.exp(-0.5 * ((t - mu) / 0.8) ** 2)
    responses[i] = bump / np.trapezoid(bump, t)

xout = np.array([[-1.2], [0.0], [1.2]])
res = frechet_global_reg(x, responses, t, xout)
pred = np.asarray(res["predicted"])          # shape (3, m)

f, ax = fig()
colors = ["#3f51b5", "#198754", "#e8710a"]
labels = [f"predictor = {v[0]:.1f}" for v in xout]
for k in range(3):
    ax.plot(t, pred[k], color=colors[k], lw=2, label=labels[k])
ax.set(
    title="Predicted conditional Fréchet mean density curves",
    xlabel="Evaluation grid",
    ylabel="Density",
)
ax.legend()
print(render(f))
print("FDARS_FENCE_OK")
5. Fréchet ANOVA — Testing Equality of Fréchet Means
frechet_anova tests whether the conditional Fréchet means of density responses differ
significantly across groups.
from fdars.frechet import frechet_anova

result = frechet_anova(responses, argvals, group_labels, n_perm=999, seed=42)
| Parameter | Type | Description |
|---|---|---|
responses |
np.ndarray (n, m) |
Density-response matrix — same format as global/local regression |
argvals |
np.ndarray (m,) |
Strictly increasing evaluation grid |
group_labels |
np.ndarray (n,) int64 |
Contiguous integer labels starting at 0 (e.g., [0, 0, 1, 1, 2]) |
n_perm |
int |
Number of permutations for the permutation p-value (default: 999) |
seed |
int |
RNG seed for reproducible permutation test (default: 42) |
Return dict (9 keys):
| Key | Type | Description |
|---|---|---|
statistic |
float |
Observed ANOVA test statistic |
p_value_asymptotic |
float |
Asymptotic p-value (chi-square approximation) |
p_value_permutation |
float |
Permutation p-value from n_perm random permutations |
n_perm |
int |
Number of permutations used |
group_frechet_variances |
np.ndarray (k,) |
Within-group Fréchet variance per group |
pooled_frechet_variance |
float |
Total (pooled) Fréchet variance |
fn_statistic |
float |
Functional n-statistic |
un_statistic |
float |
Functional U-statistic |
group_labels |
np.ndarray (n,) |
Group labels (echoed) |
Group label requirement
Labels must be contiguous integers starting at 0 (e.g., [0, 0, 1, 1]).
Non-contiguous labels (e.g., [0, 1, 3]) raise ValueError.
Two separate significance keys — asymptotic and permutation
The result dict exposes two distinct significance estimates, not a single generic key.
Use p_value_asymptotic for a fast large-sample chi-square approximation or
p_value_permutation for a non-parametric test. Both are always present; choose
the one appropriate for your sample size.
import numpy as np
from docs_fig import fast
from fdars.frechet import frechet_anova

rng = np.random.default_rng(13)
n_per, m = 10, 30
t = np.linspace(-3.0, 3.0, m)

# Group 0: bumps centred near -1; Group 1: centred near +1.
groups = []
for mu in [-1.0, 1.0]:
    for _ in range(n_per):
        bump = np.exp(-0.5 * ((t - (mu + rng.normal(0, 0.2))) / 0.7) ** 2)
        groups.append(bump / np.trapezoid(bump, t))

responses = np.vstack(groups)                                    # (20, m)
group_labels = np.array([0]*n_per + [1]*n_per, dtype=np.int64)  # contiguous 0..1

result = frechet_anova(responses, t, group_labels,
                       n_perm=fast(999, 99), seed=42)

print(f"statistic:              {result['statistic']:.4f}")
print(f"p_value_asymptotic:     {result['p_value_asymptotic']:.4f}")
print(f"p_value_permutation:    {result['p_value_permutation']:.4f}")
print(f"pooled_frechet_variance:{result['pooled_frechet_variance']:.4f}")
print("FDARS_FENCE_OK")
statistic: 365.0618 p_value_asymptotic: 0.0000 p_value_permutation: 0.0010 pooled_frechet_variance:1.1238 FDARS_FENCE_OK
Methods available in the R package but not (yet) in Python
Methods available in the R package but not (yet) in Python
- Wasserstein barycenter estimation:
frechet_global_reguses Petersen–Müller signed-weight quantile averaging, which allows negative weights in extrapolation regions. This is not equivalent to a Wasserstein barycenter (which requires non-negative weights). True Wasserstein barycenter regression is not currently exposed infdars. - SPD affine-invariant geodesic regression:
frechet_meanwithspace="spd"uses the Frobenius metric only. Geodesic regression along the SPD manifold under the affine-invariant metric is not directly exposed.
References
- Petersen, A. and Müller, H.-G. (2019). Fréchet regression for random objects with Euclidean predictors. Annals of Statistics 47(2), 691–719.
- Fréchet, M. (1948). Les éléments aléatoires de nature quelconque dans un espace distancié. Annales de l'Institut Henri Poincaré 10(4), 215–310.
- Tucker, J. D., Wu, W. and Srivastava, A. (2013). Generative models for functional data using phase and amplitude separation. Computational Statistics & Data Analysis 61, 50–66.
See also
- Scalar-on-Function Regression — Euclidean response alternative when the functional predictor maps to a scalar
- Regression Diagnostics — residual diagnostics applicable after Fréchet regression
- Uncertainty Quantification — bootstrap confidence intervals for regression estimates
- Regression index — overview of all regression methods in
fdars